Pennsylvania
State Report: 2014-15
View State WebsiteThe NCI Adult Consumer Survey is an interview conducted with a person who is receiving services from the state; it is used to gather data on approximately 60 consumer outcomes, and it is regularly refined and tested to ensure that it is valid and reliable. Interviewers meet with individuals to ask questions about where they live and work, the kinds of choices they make, the activities they participate in within their communities, their relationships with friends and family, and their health and well-being.
Demographics

Other Diagnoses: Anxiety disorder (e.g., obsessive disorders, panic disorders, etc.)
Other Diagnoses: Behavior challenges (e.g., aggression, self-injurious behavior, etc.)

Other Diagnoses: Mood disorder (e.g., depression, mania, bipolar disorder, etc.)
Other Diagnoses: Other Mental Illness/Psychiatric Diagnosis

Other Diagnoses: Psychotic disorder (e.g., schizophrenia, hallucinations, etc.)
Health
People secure needed health services.
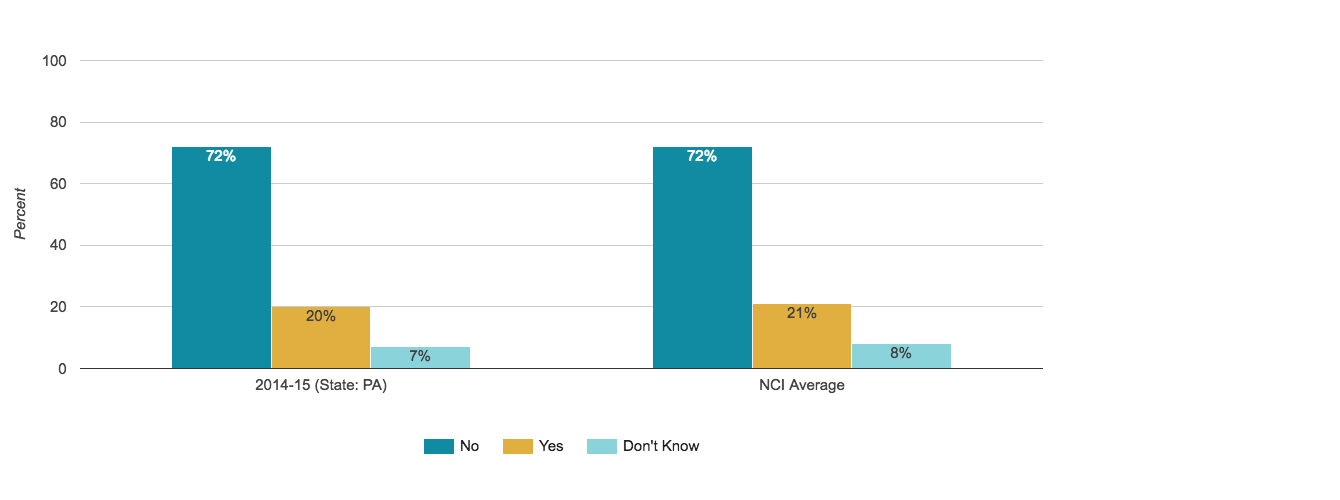
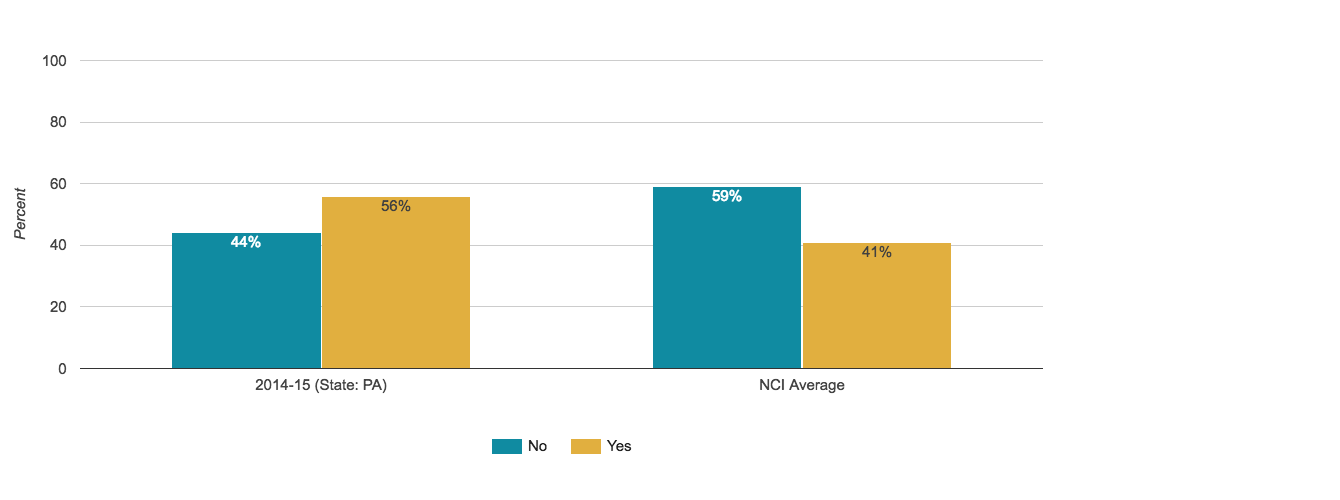
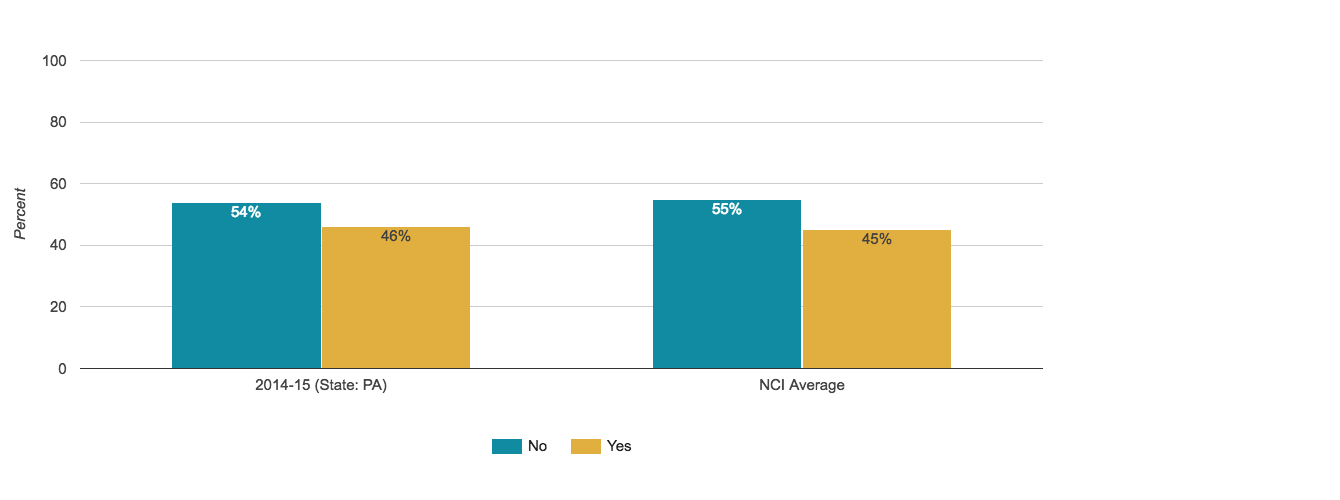
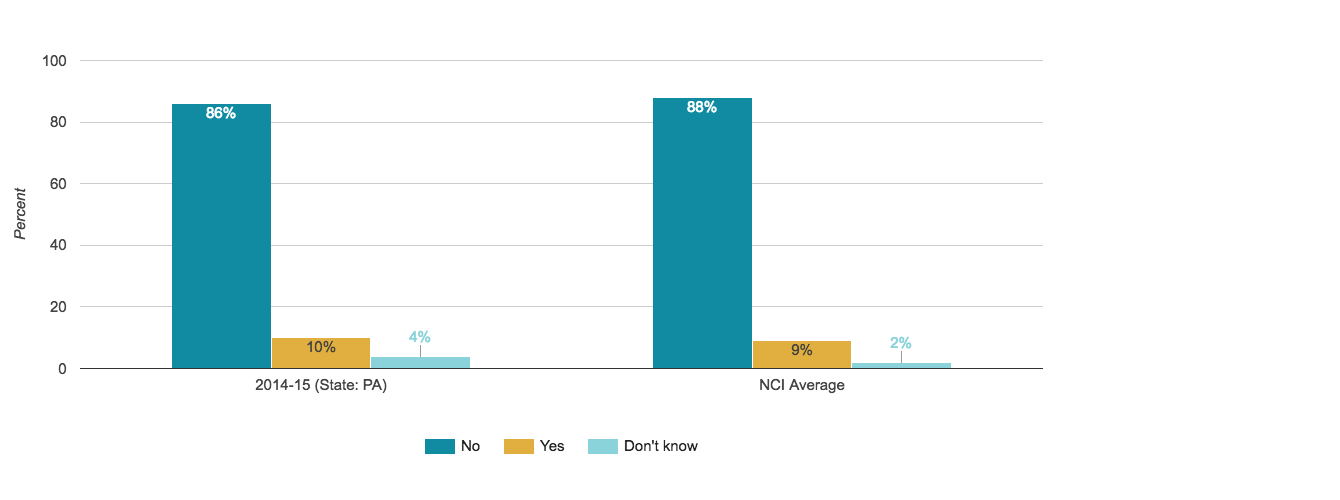
Had a Flu Vaccine (in the Past Year)
Proportion of people who were reported to have had a flu vaccine in the past year
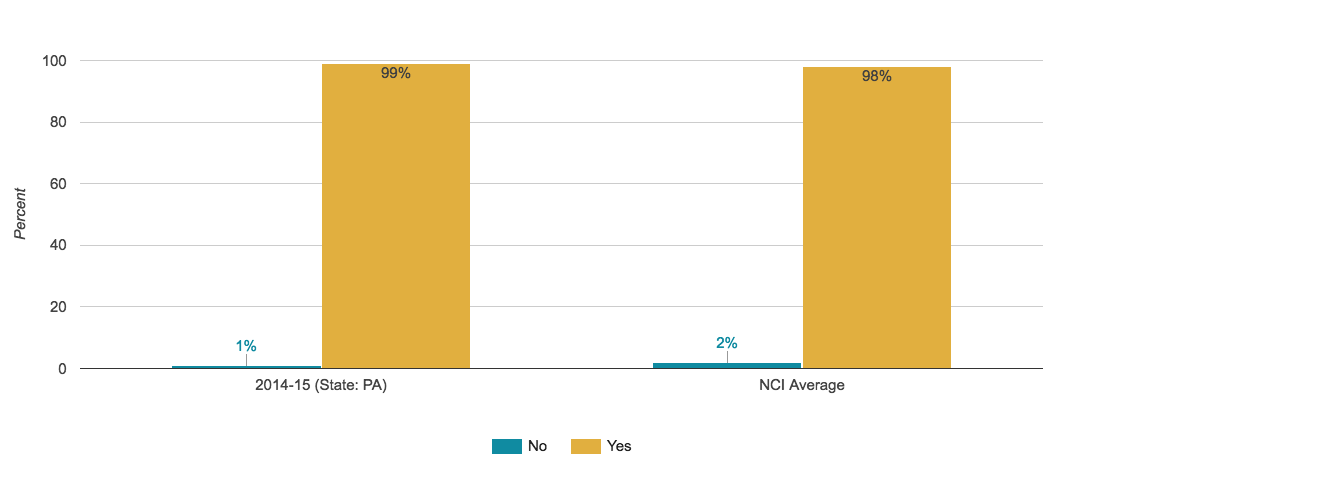
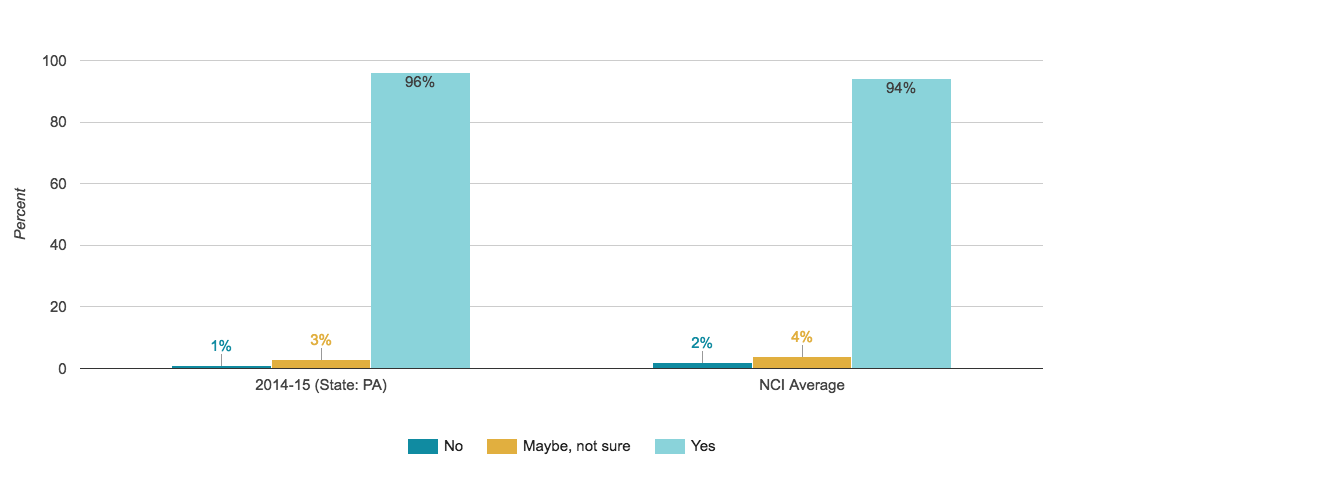
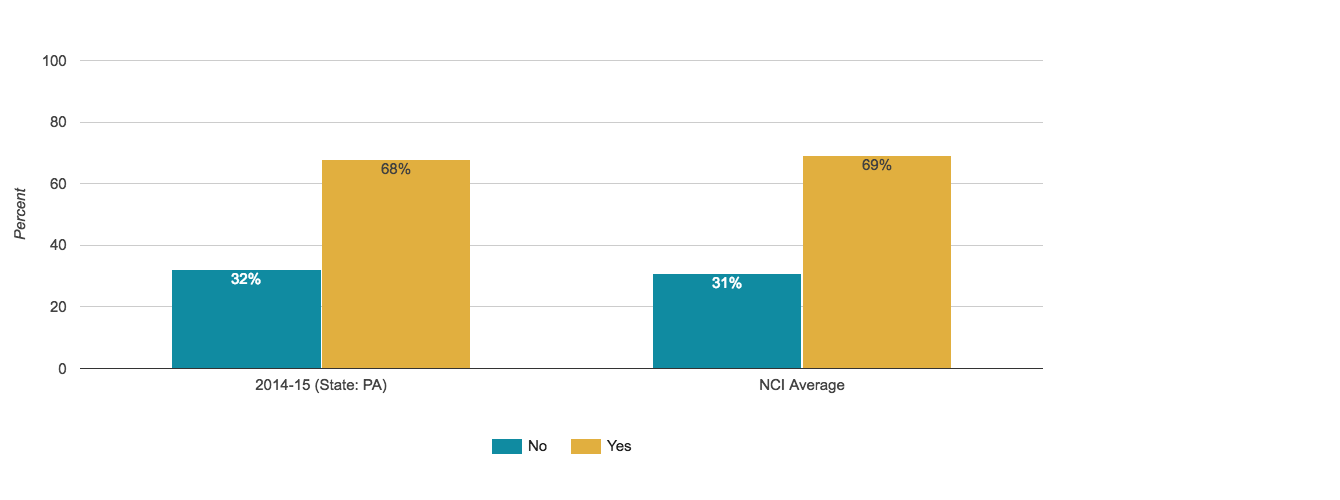
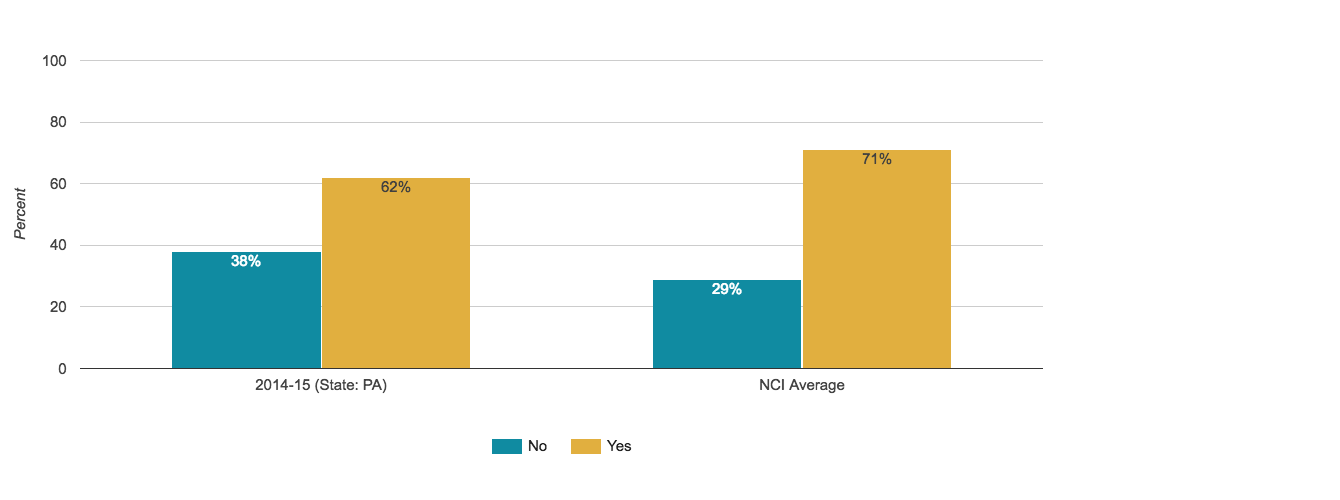
Has a Primary Care Doctor
Proportion of people who were reported to have a primary care doctor
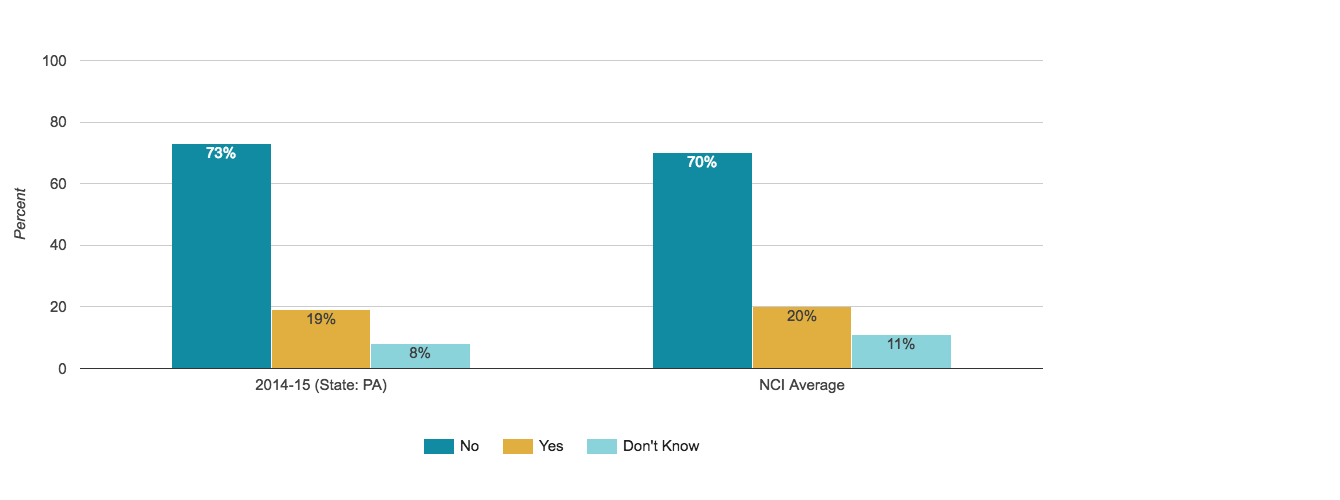
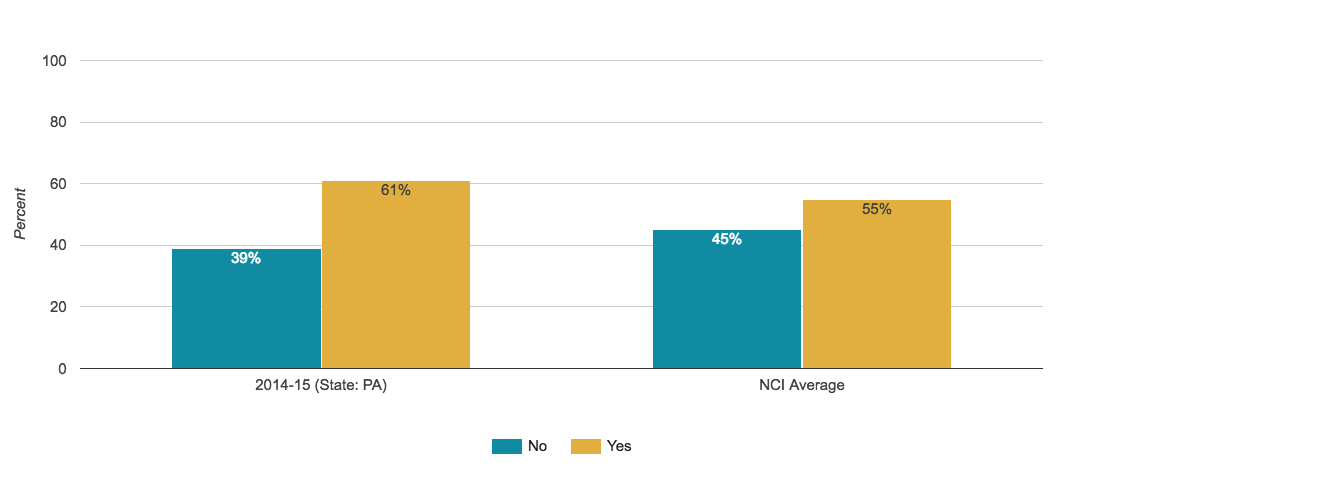
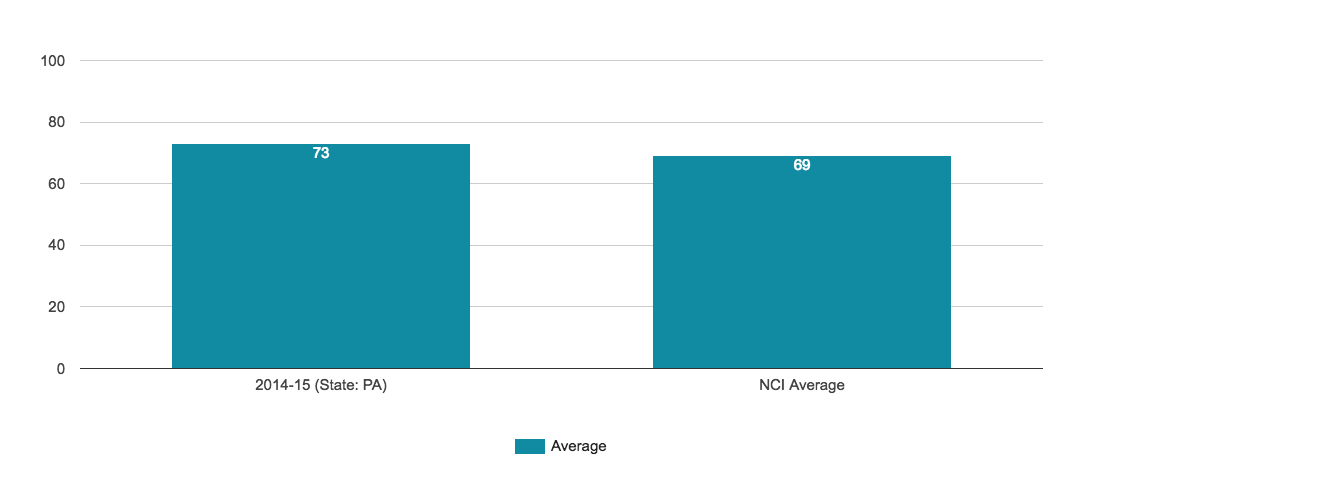
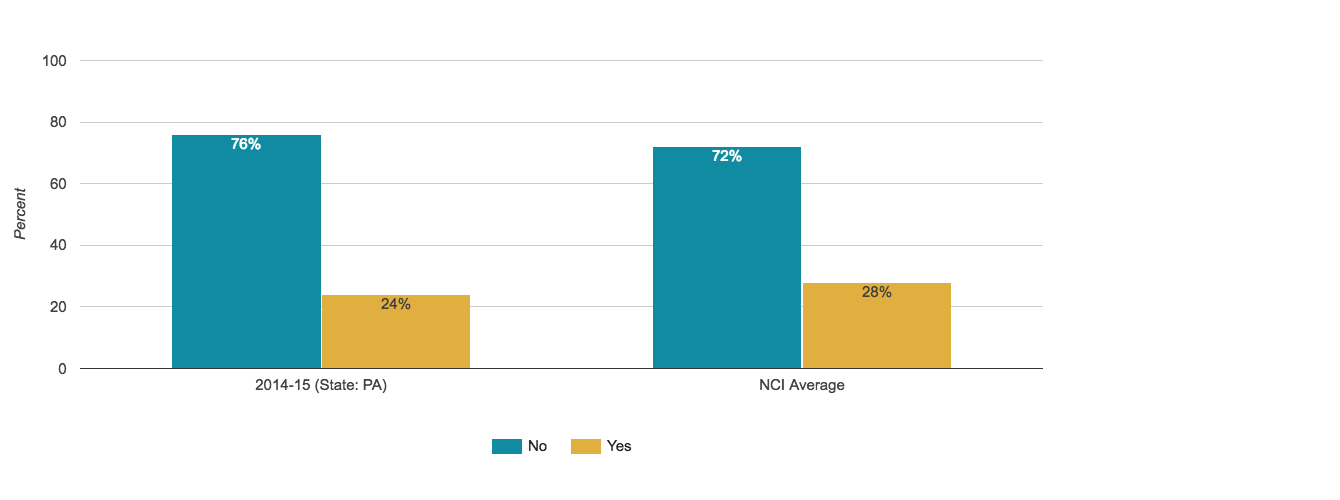
Has Ever Been Vaccinated for Pneumonia
Proportion of people who were reported to have had a pneumonia vaccine
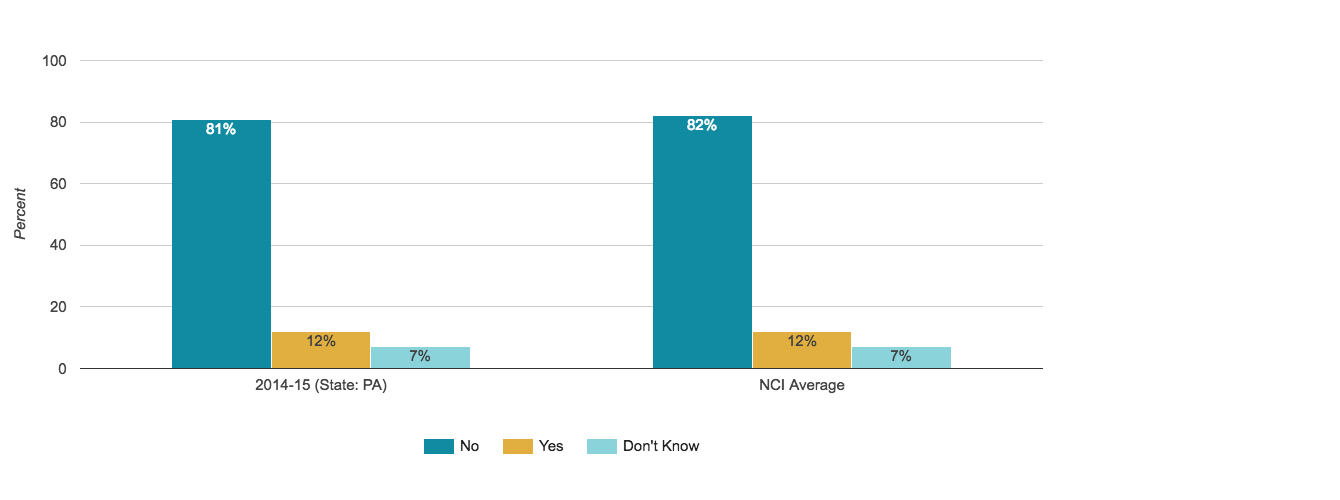
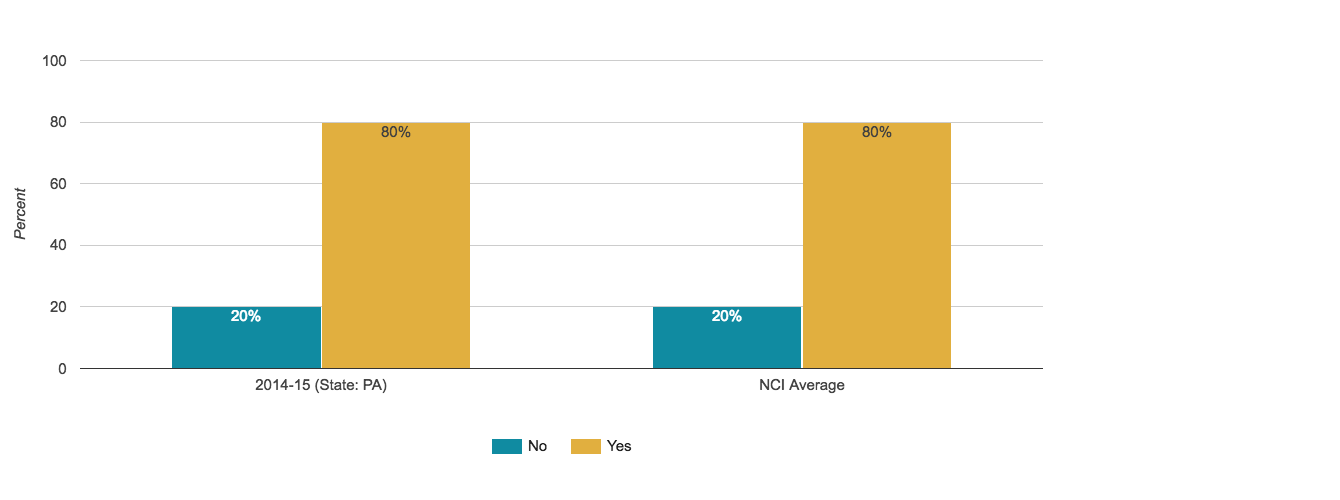
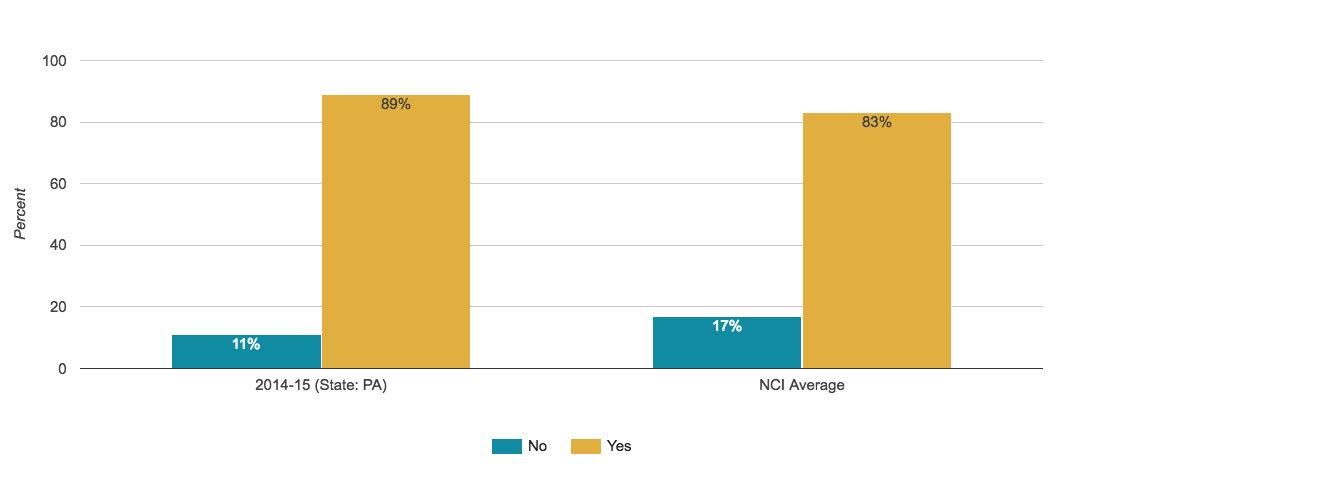
Last Colorectal Cancer Screening (Age 50 and Over)
Proportion of people 50 or over who were reported to have had a colorectal cancer screening in the past year
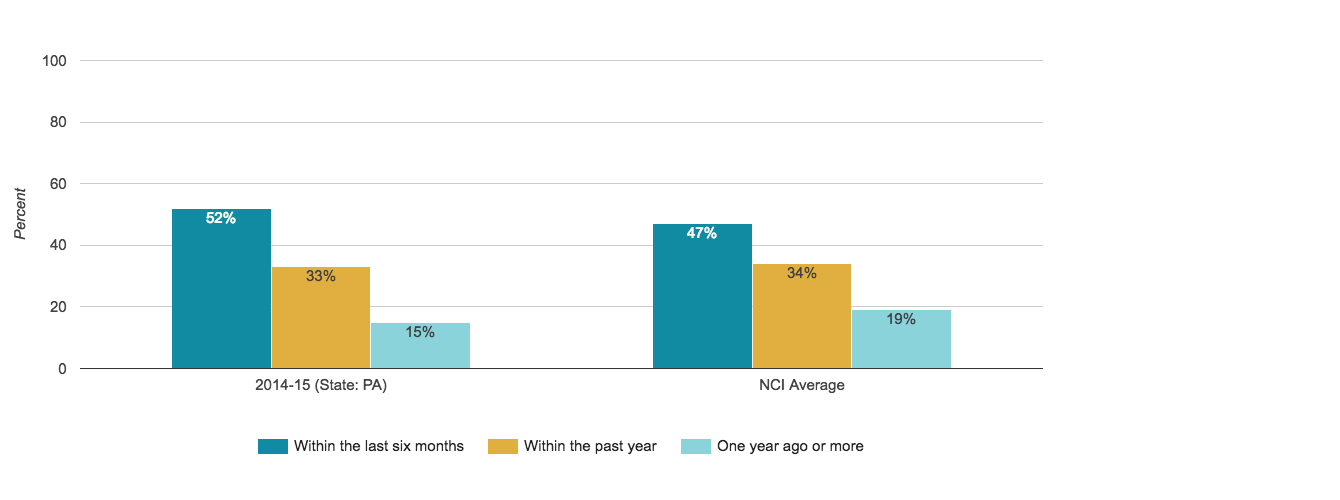
Last Dental Exam
Proportion of people who were reported to have had a dental exam in the past year
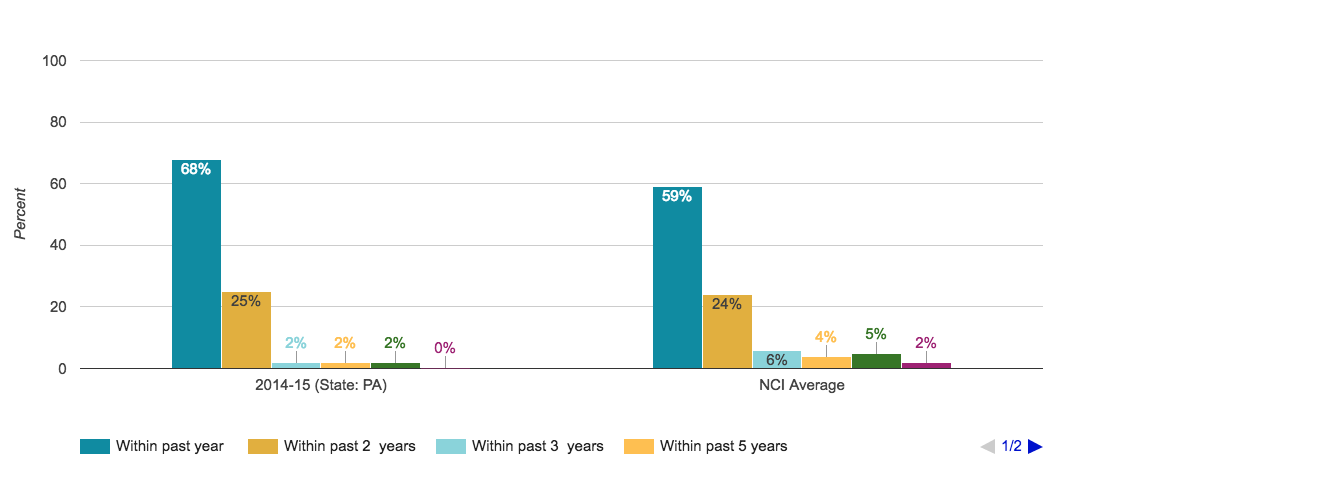
Last Eye Exam or Vision Screening
Proportion of people who were reported to have had an eye exam in the past year
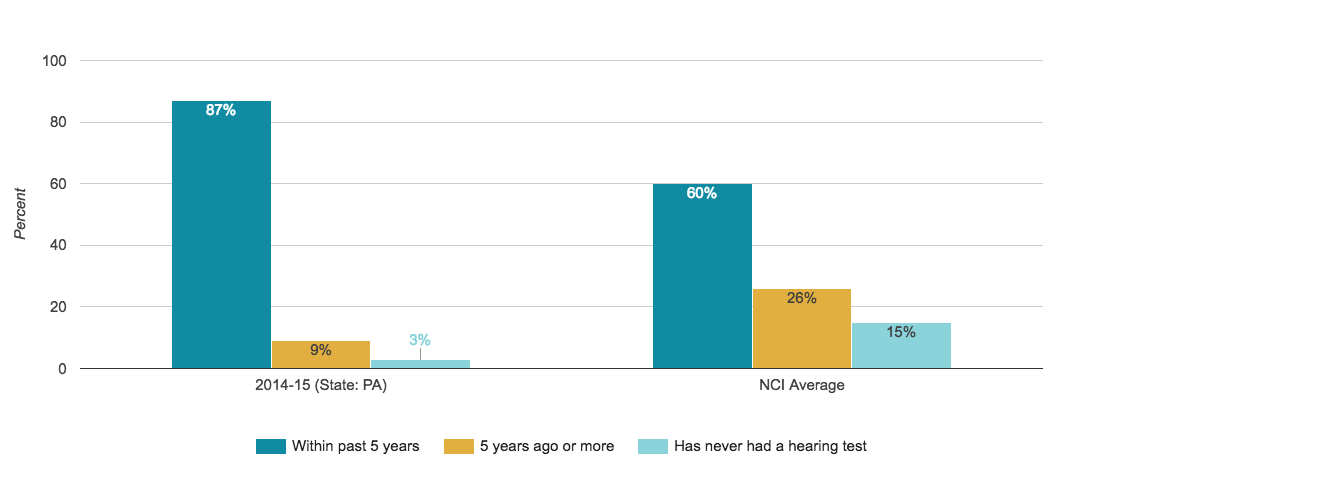
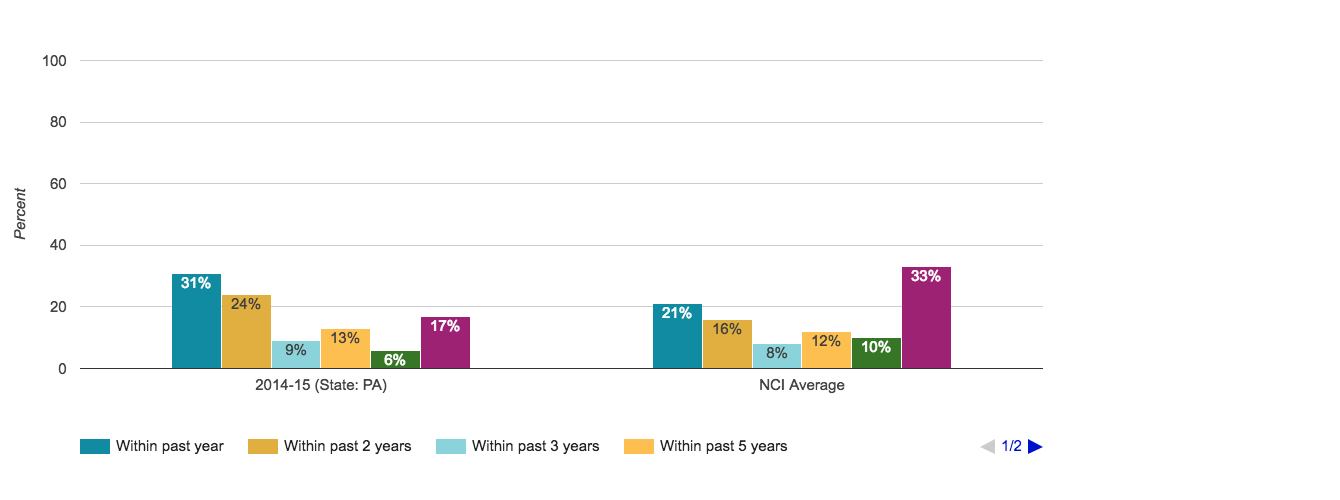
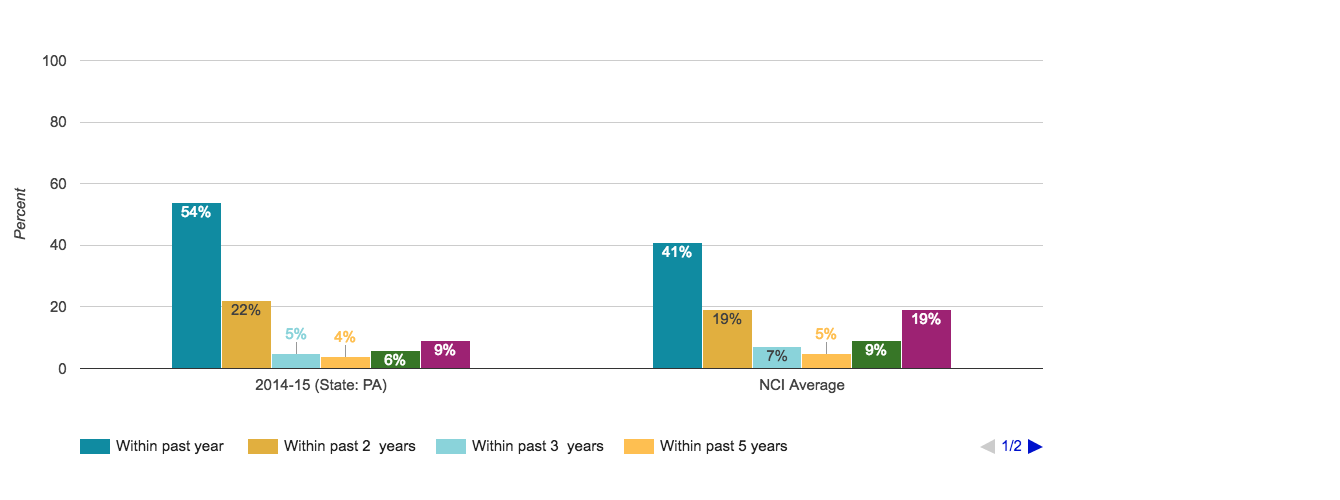
Last Hearing Test
Proportion of people who were reported to have had a hearing test in the past five years
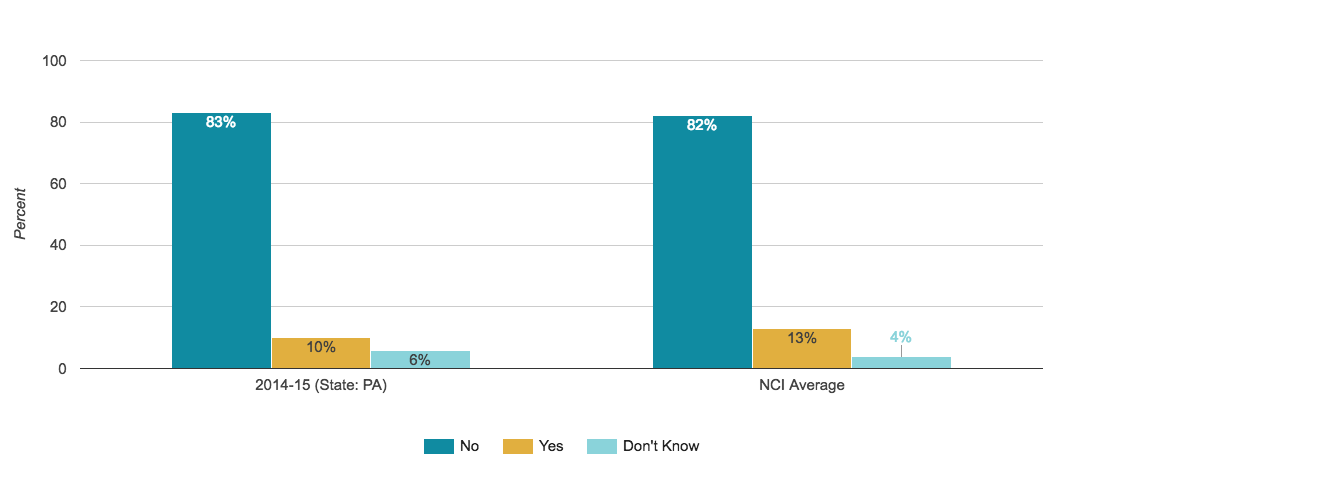
Last Mammogram (Women 40 and Over)
Proportion of women over 40 who were reported to have had a mammogram test in the past two years
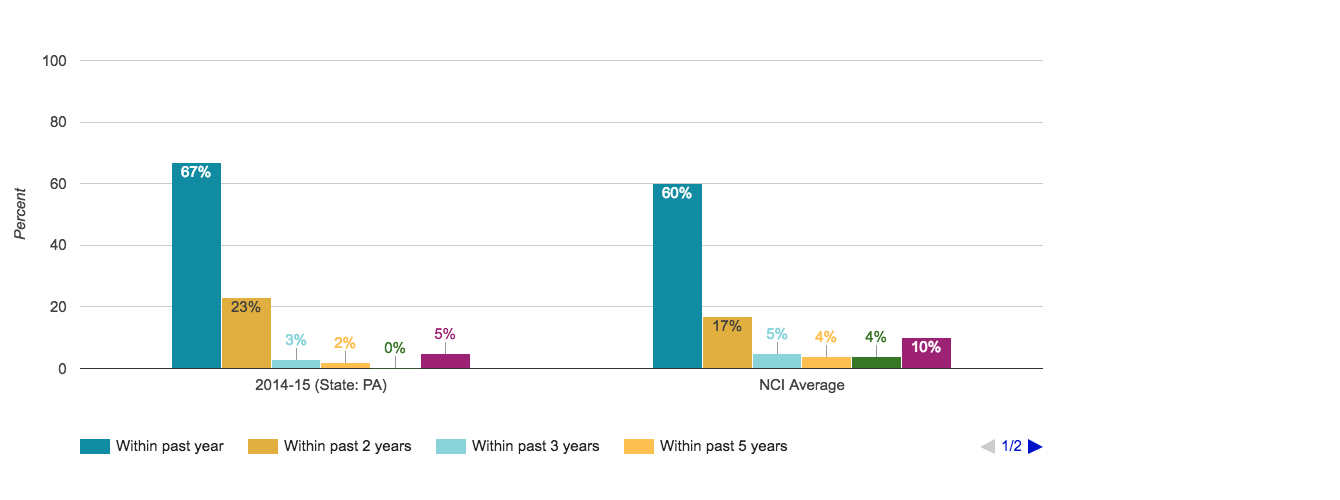
Last Pap Test (women)
Proportion of women who were reported to have had a Pap test in the past three years
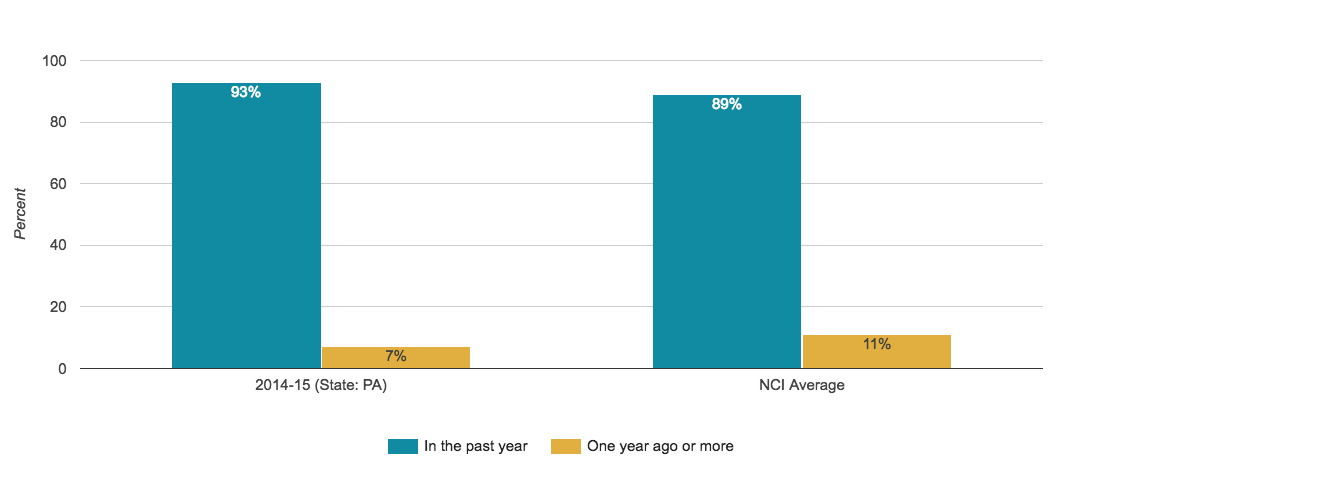
Last Physical Exam
Proportion of people who were reported to have had a complete physical exam in the past year
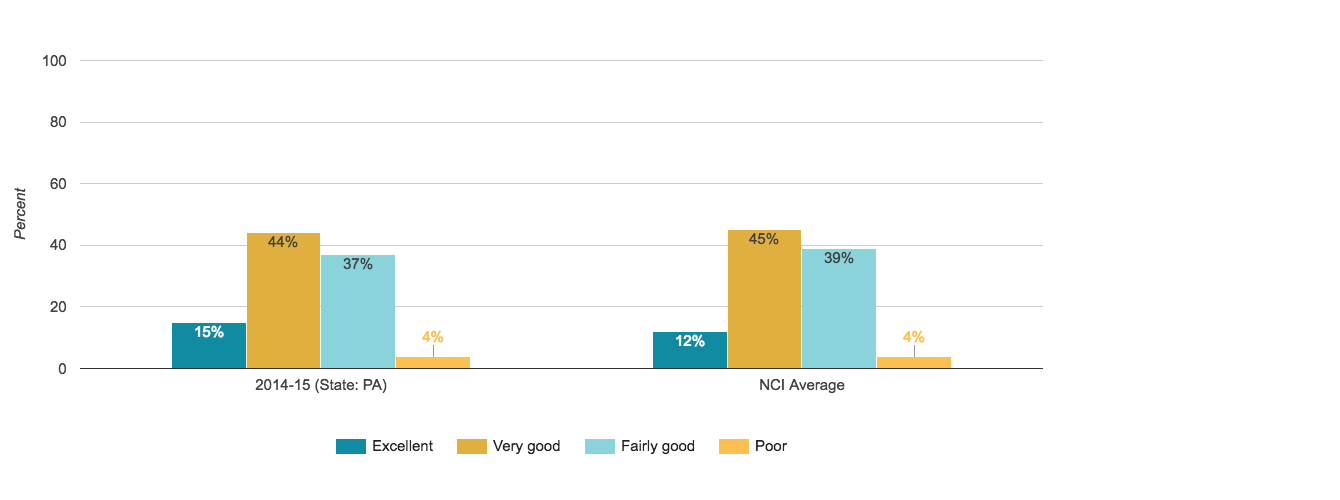
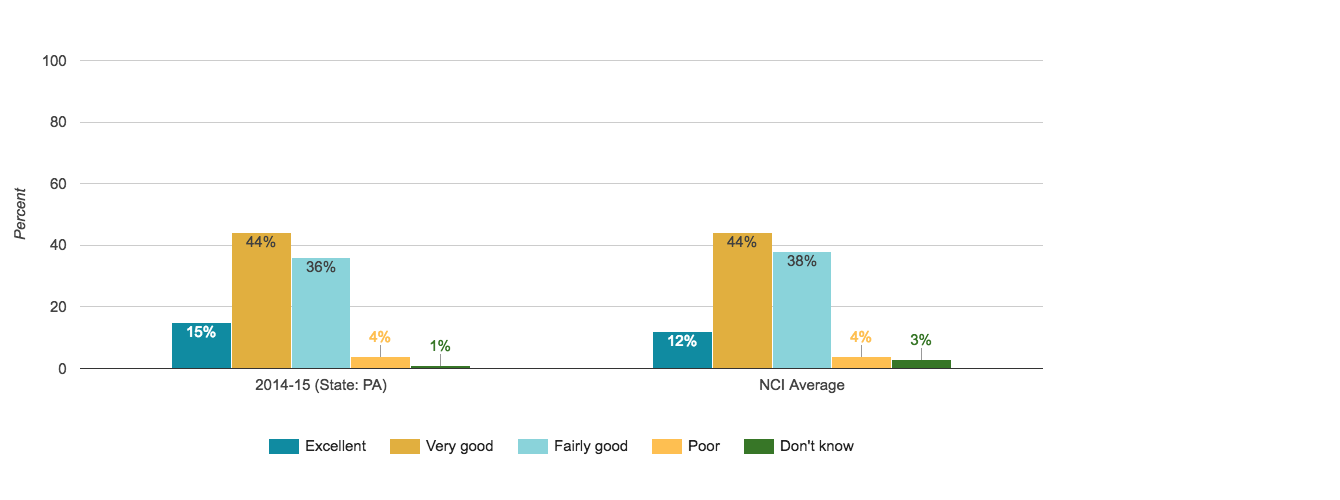
Overall Health
Proportion of people who were reported to be in poor health
Medications
Medications are managed effectively and appropriately.
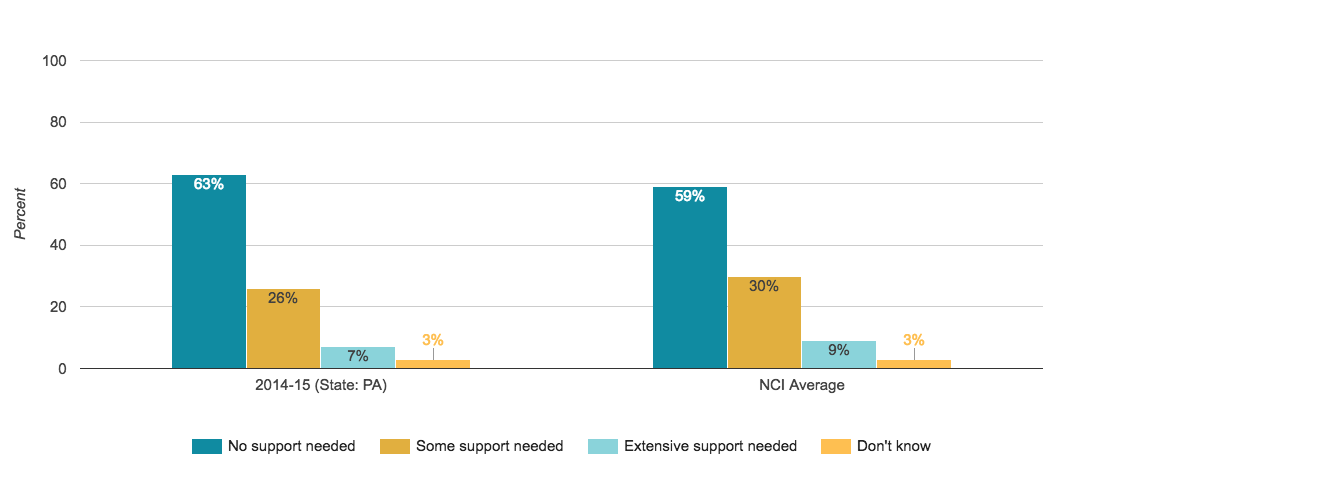
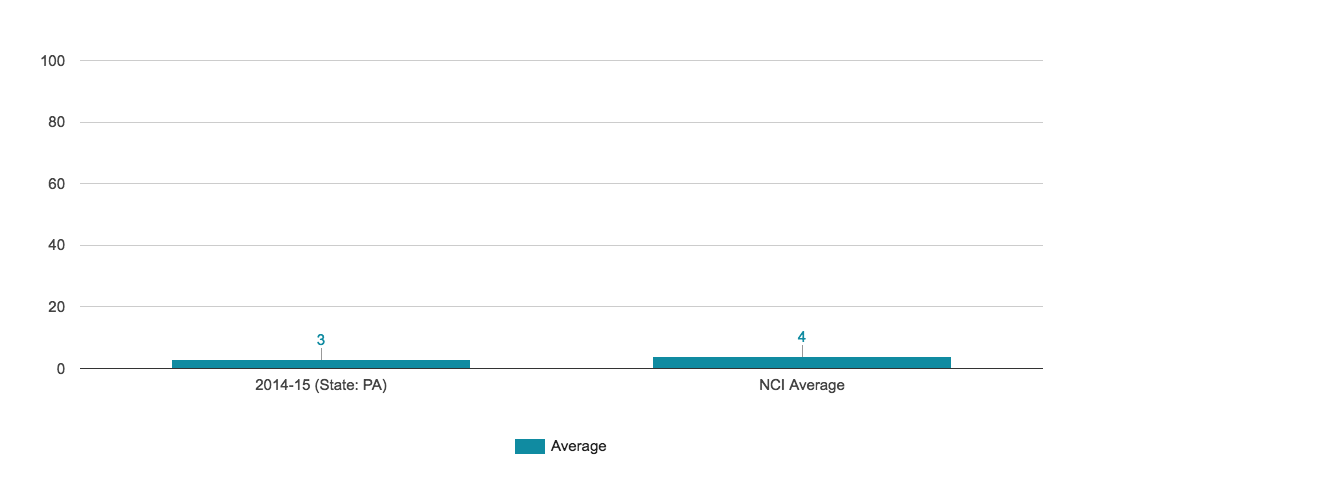
Number of Medications Taken for Behavioral Challenges
Number of meds taken for behavior challenges
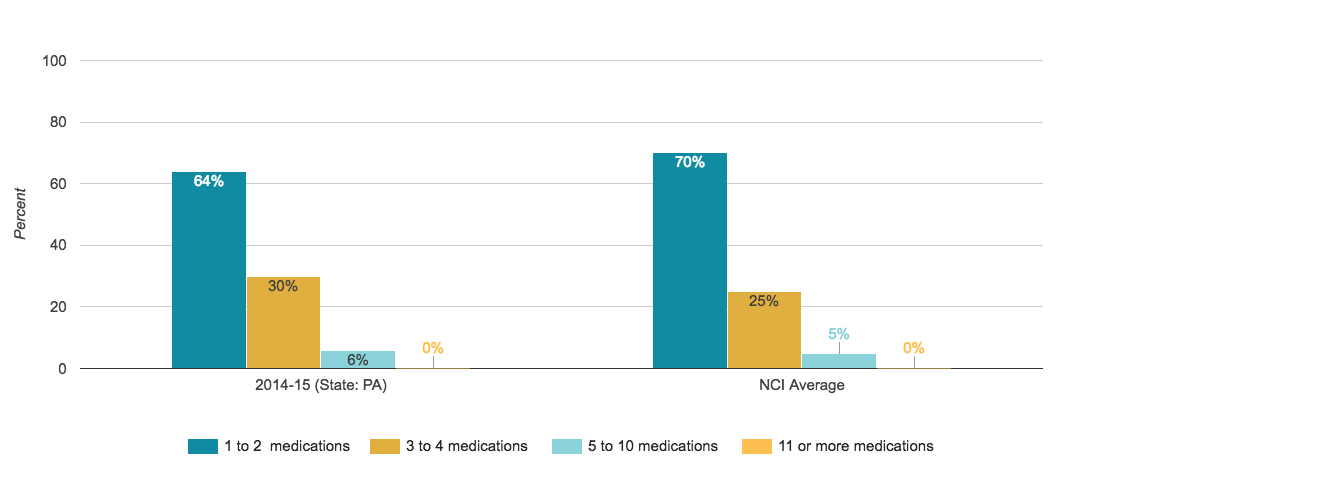
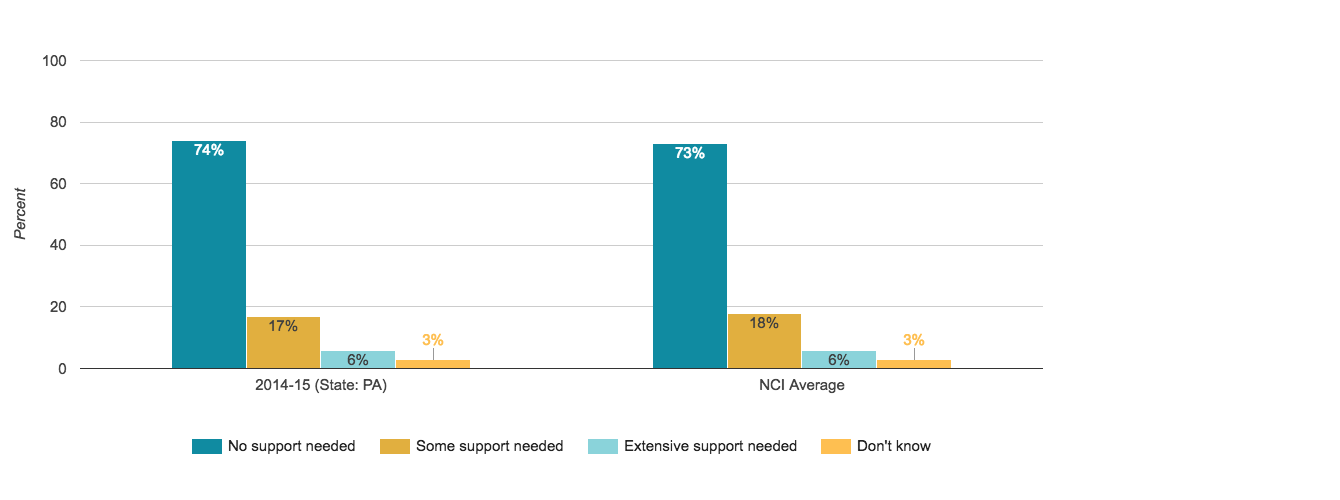
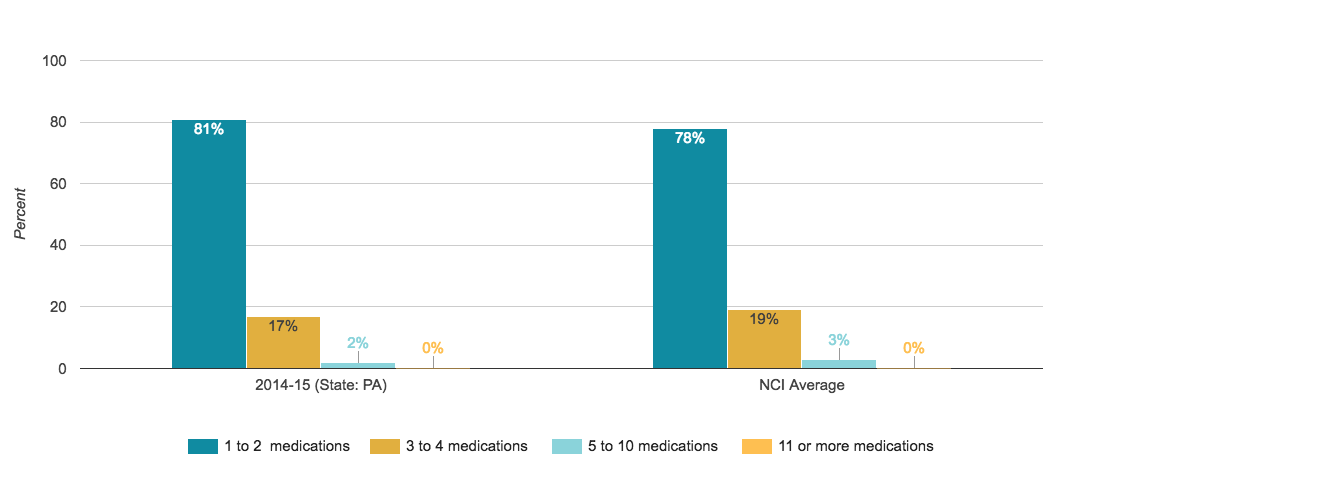
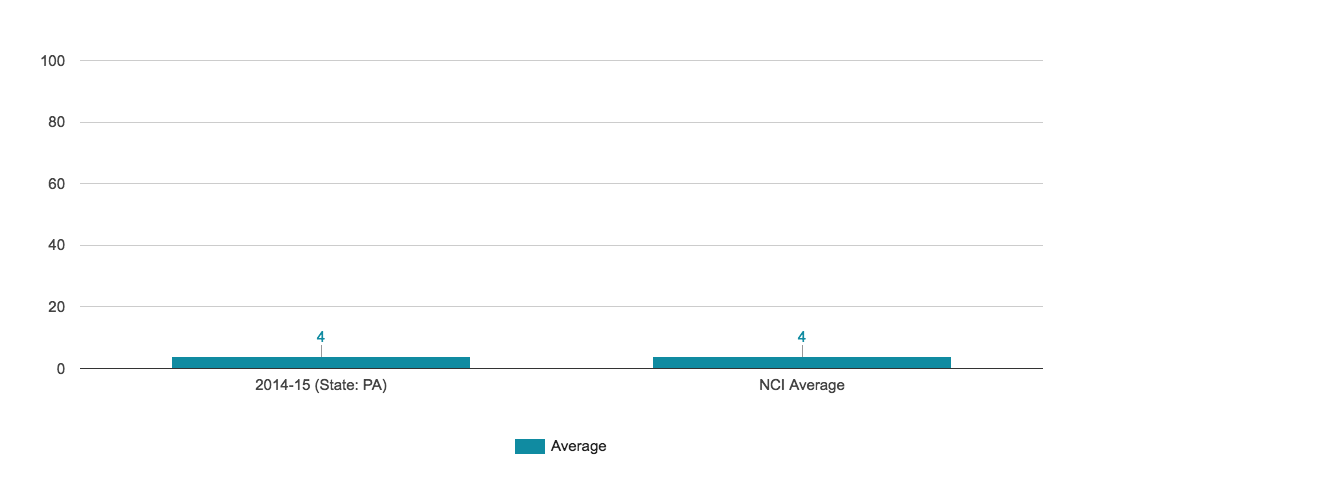
Number of Medications Taken For Mood Disorders, Anxiety and/or Psychotic Disorders
Number of meds taken for at least one of the following: mood disorders, anxiety, psychotic disorders
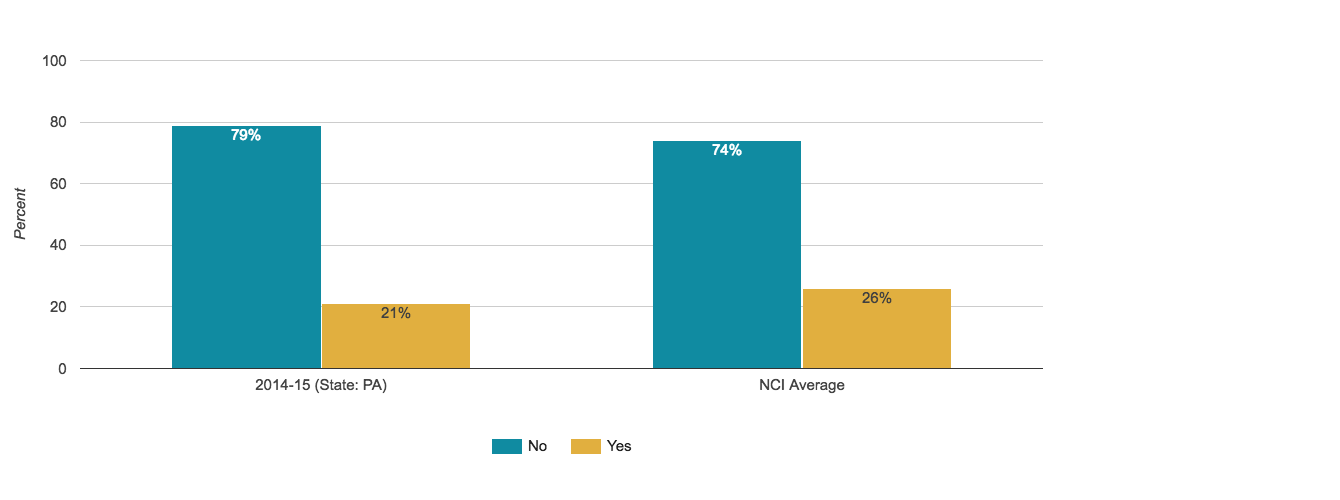
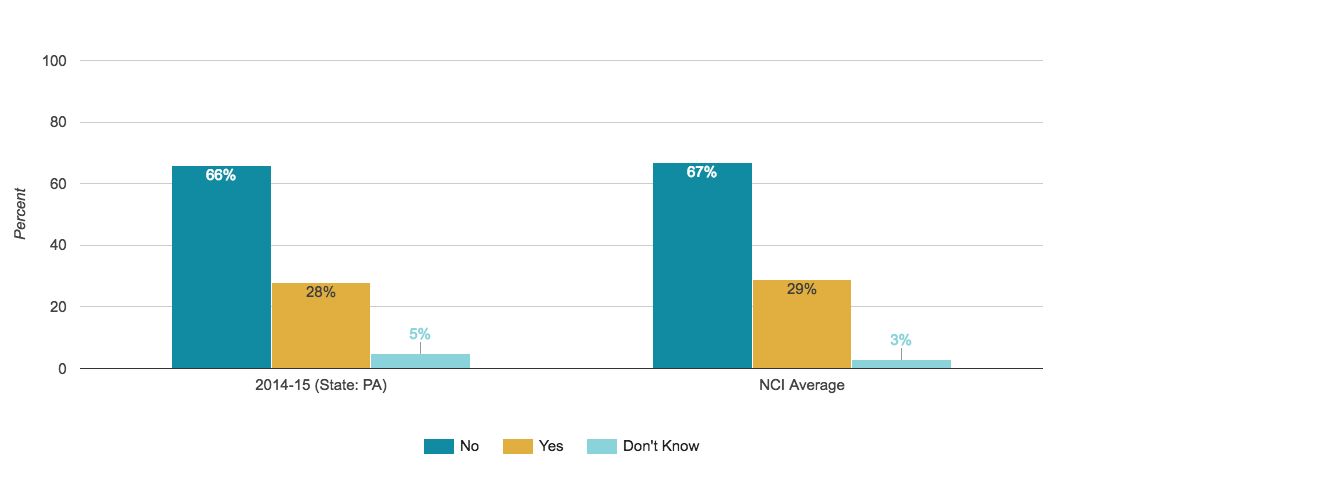
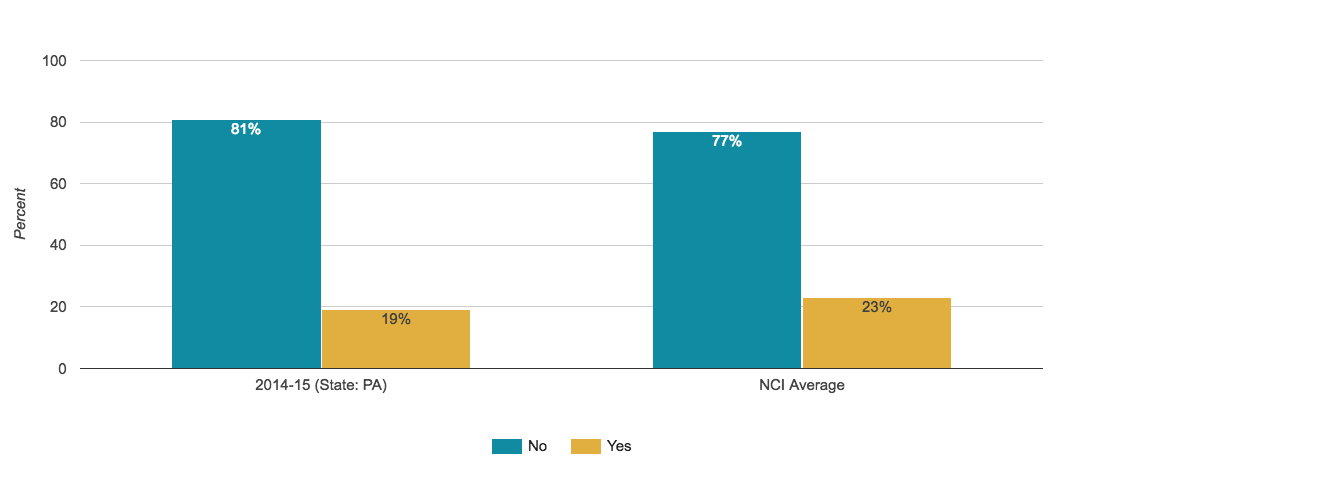
Takes at Least One Medication for Behavior Challenges
Proportion of people who were reported to take medication for behavior challenges**
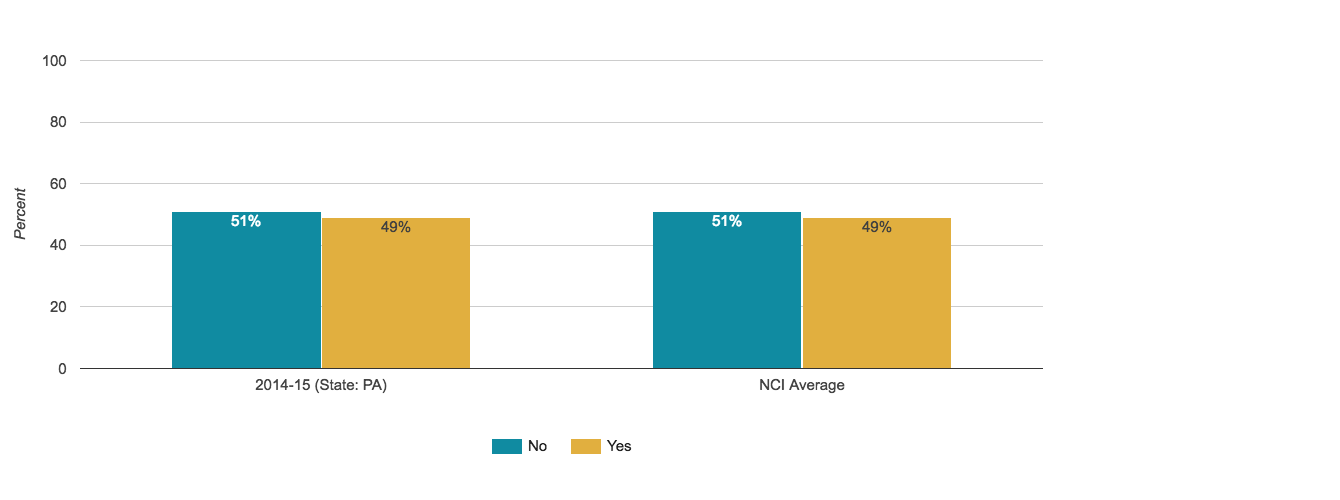
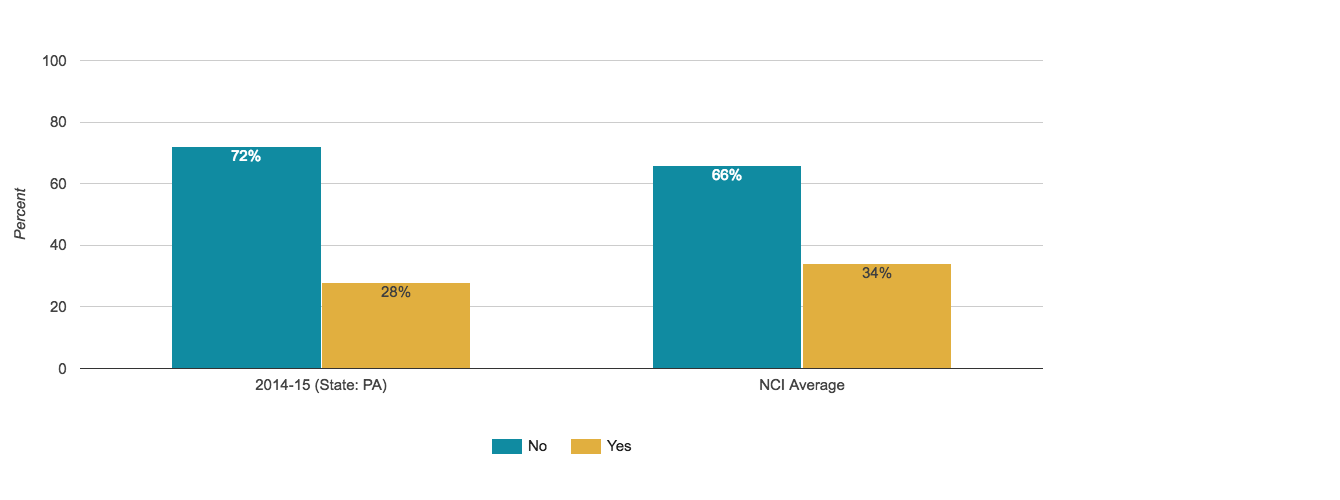
Takes At Least One Medication for Mood Disorders, Anxiety, and/or Psychotic Disorders
Proportion of people who were reported to take medication for at least one of the following: mood disorders, anxiety, psychotic disorders**
Respect/Rights
People receive the same respect and protections as others in the community.
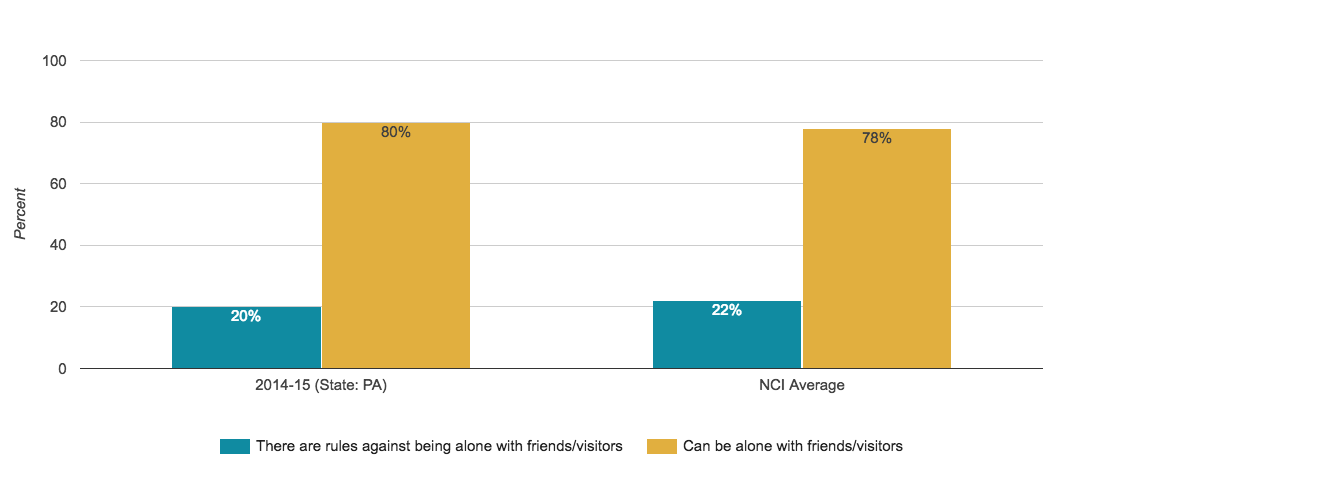
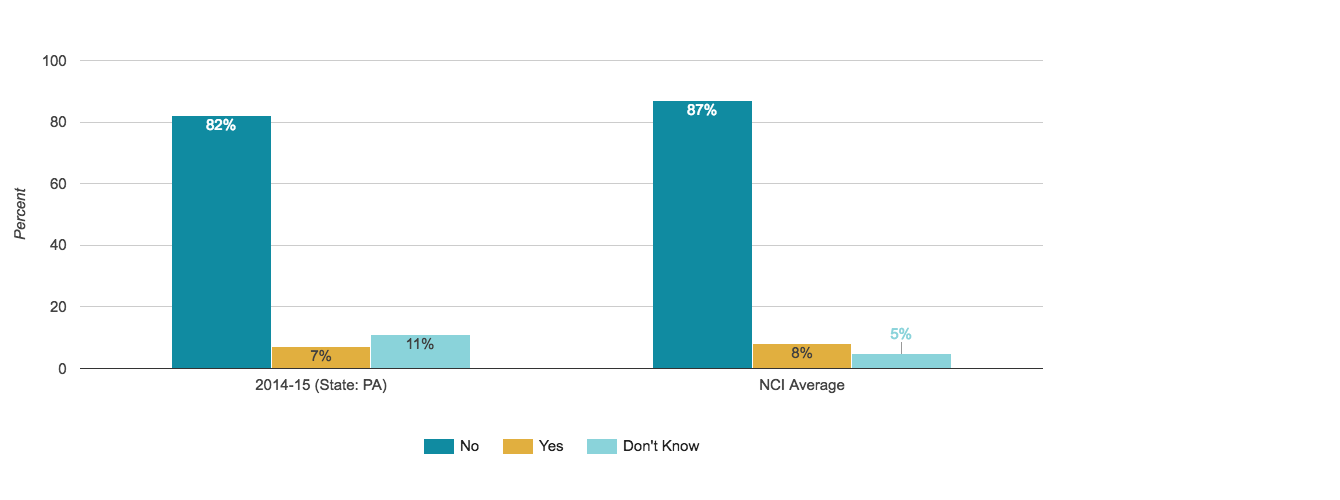
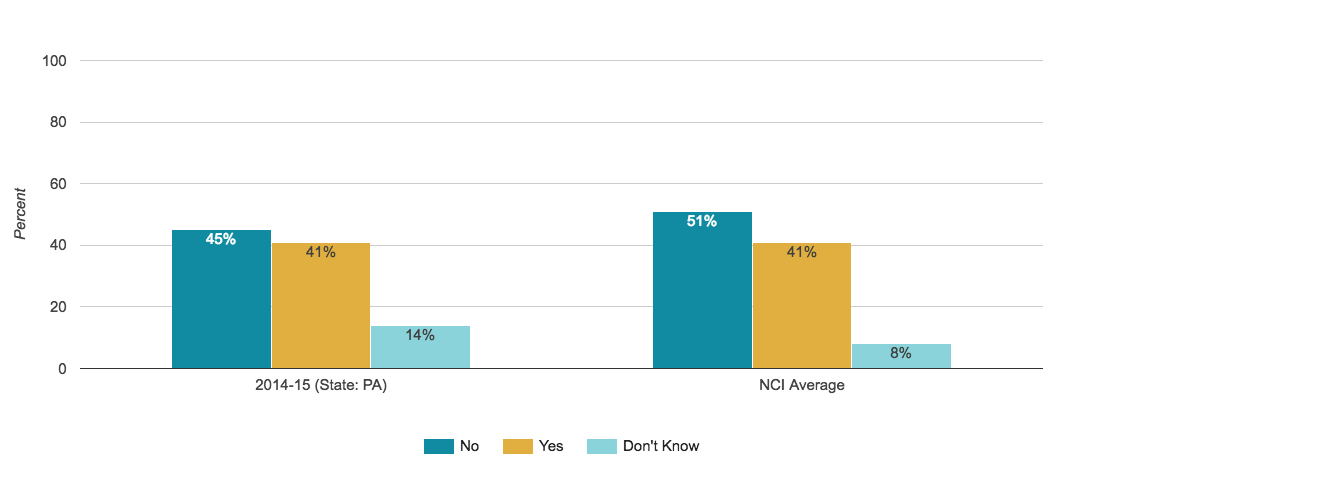
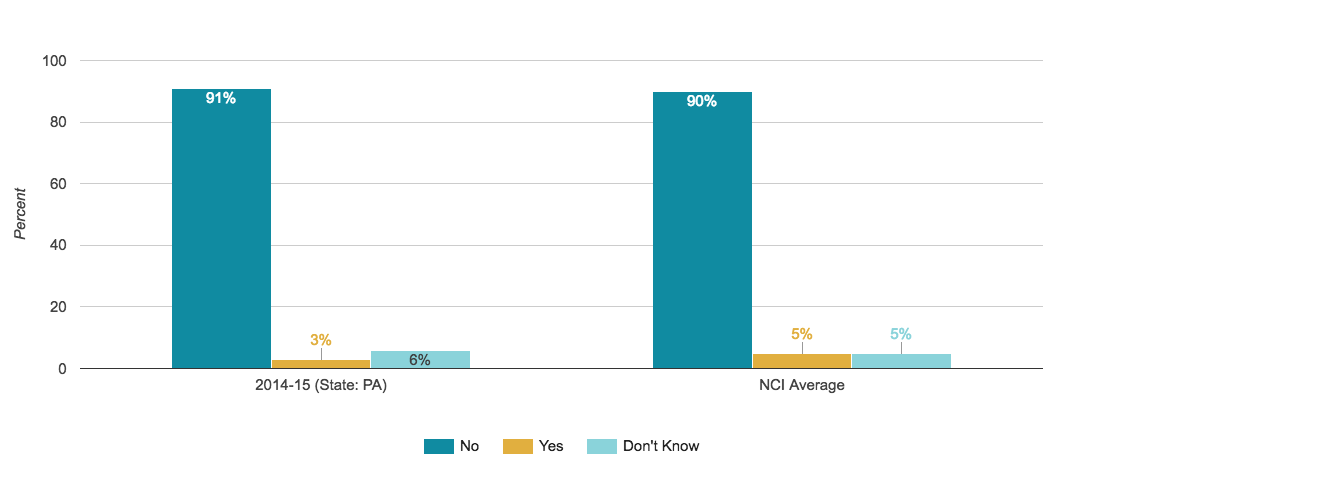
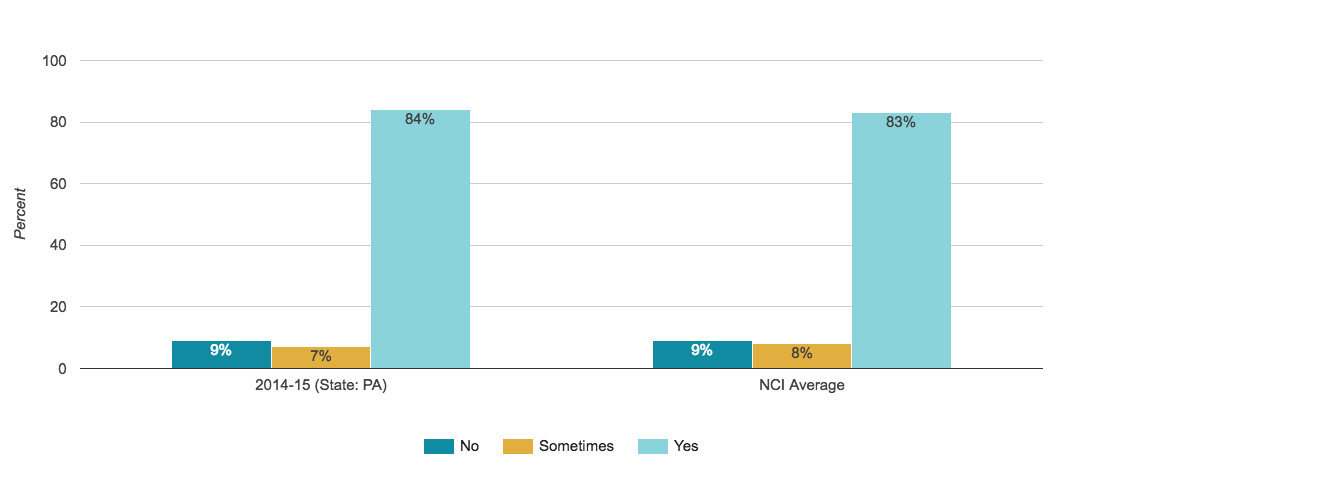
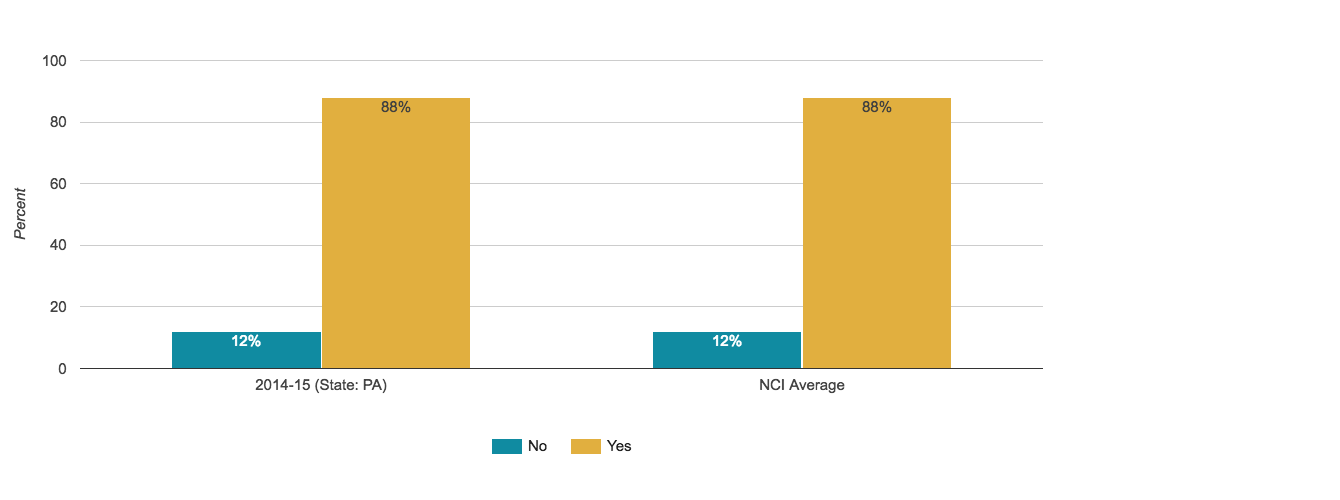
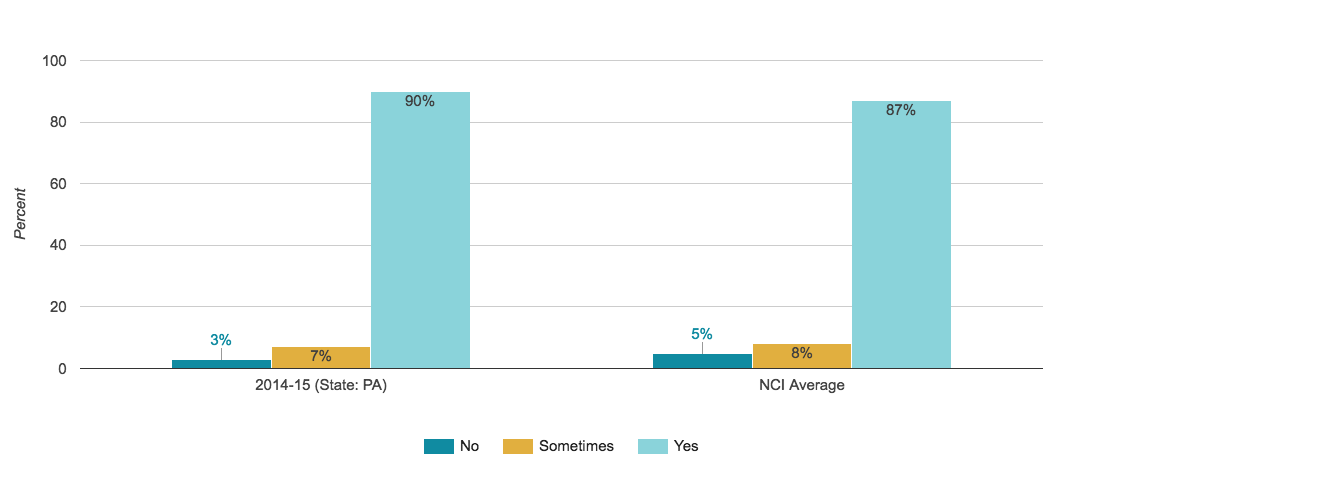
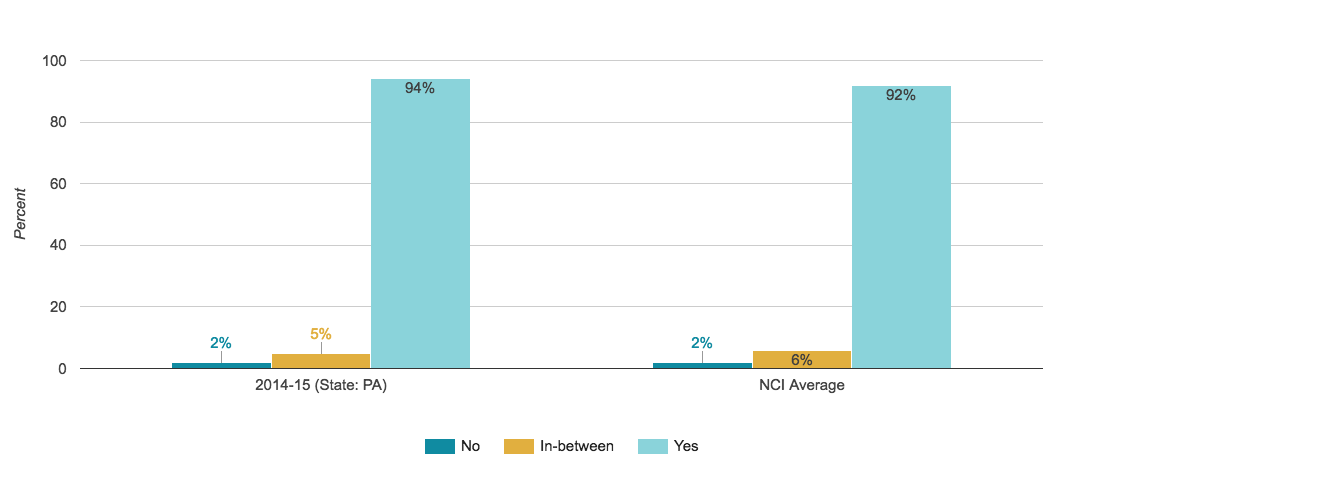
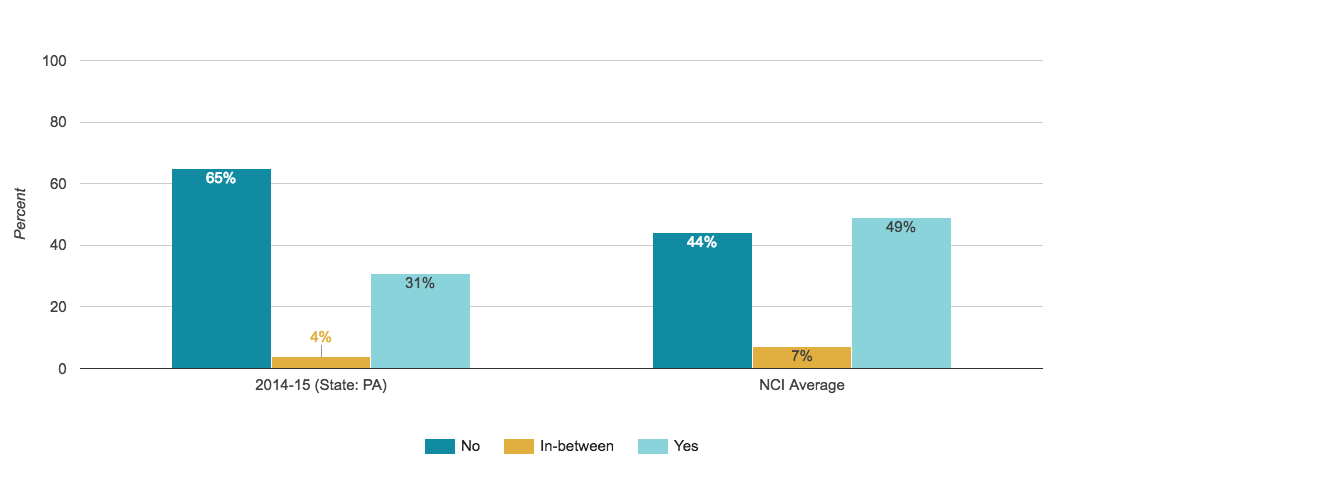
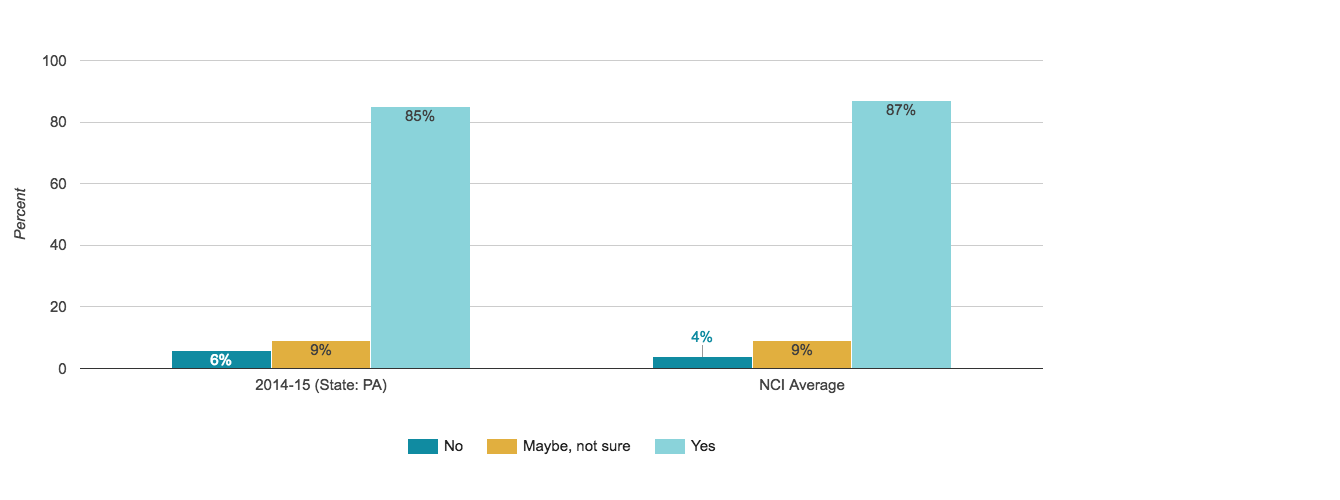
Can Be Alone at Home With Visitors or Friends
Proportion of people who reported they could be alone at home with visitors
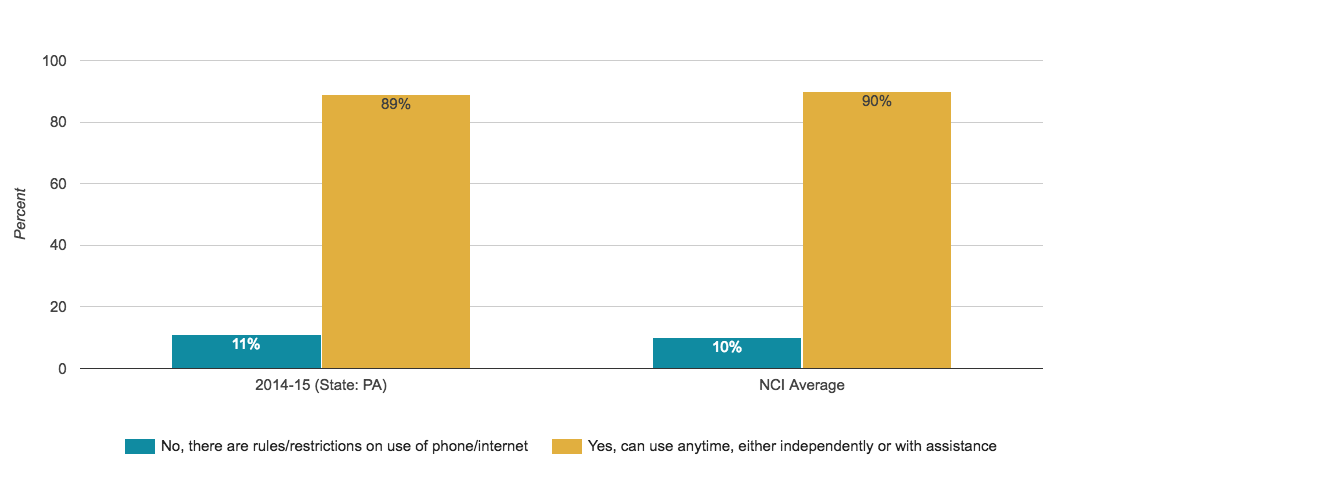
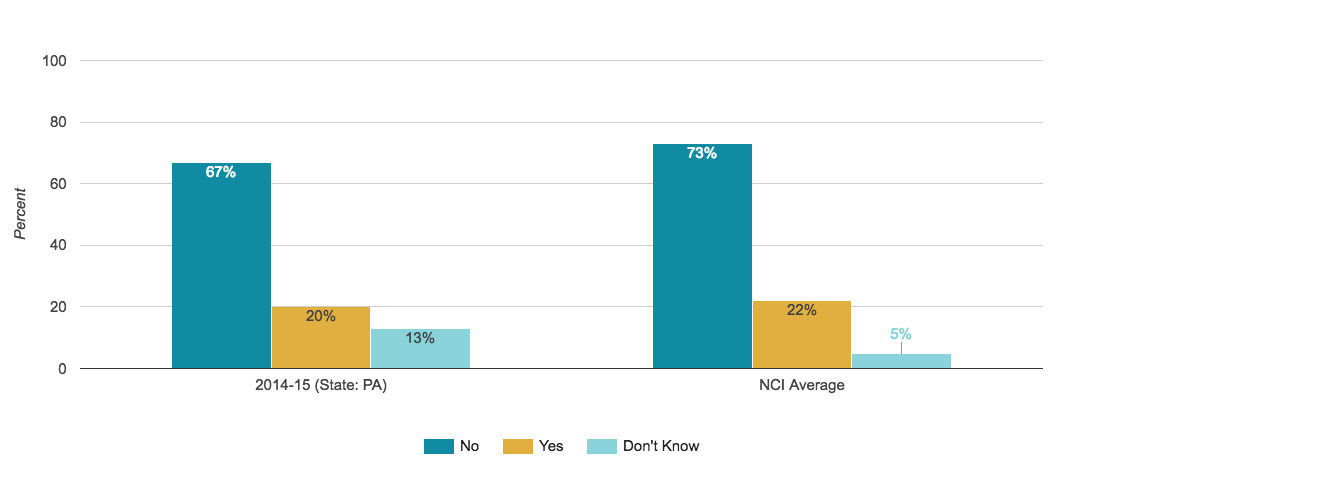
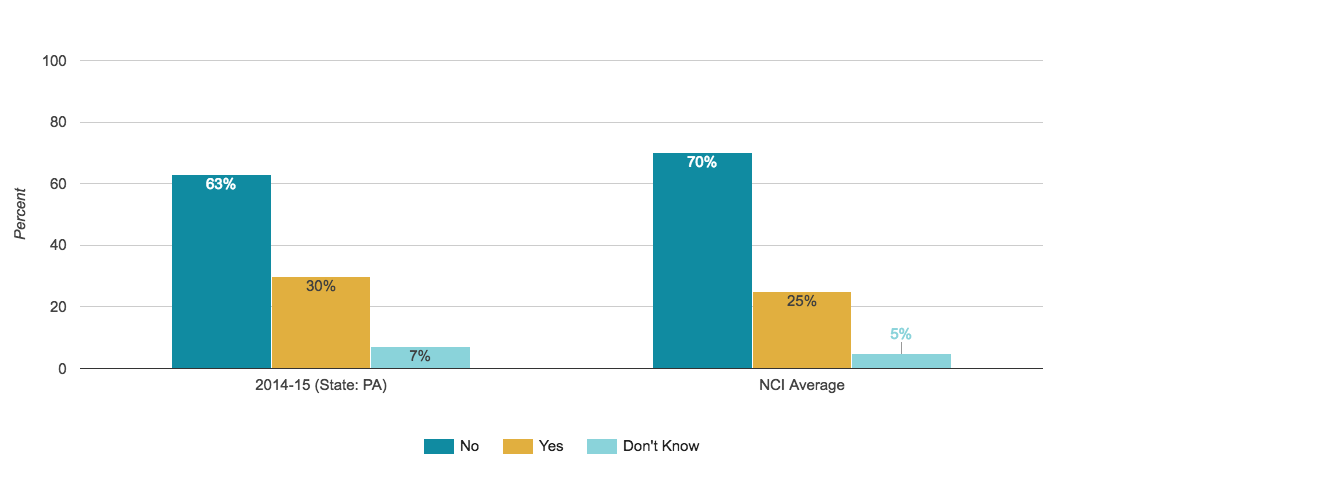
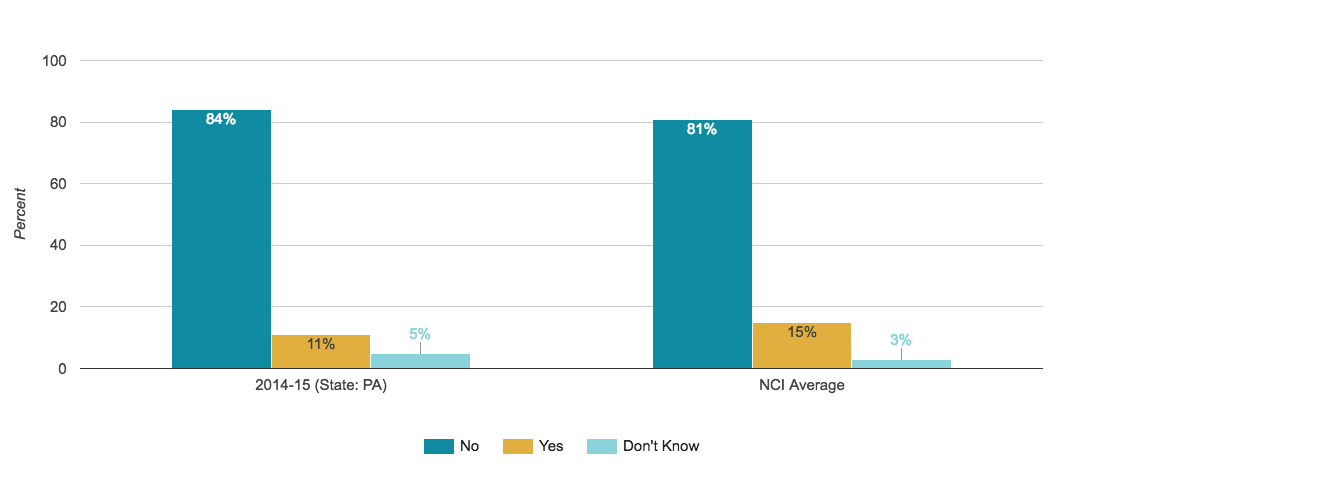
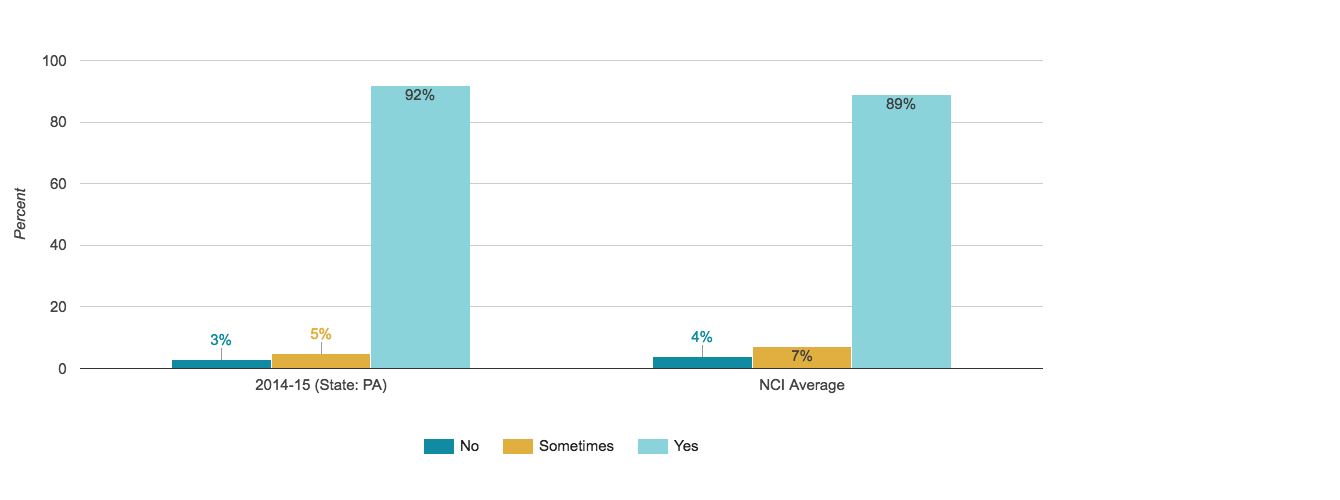
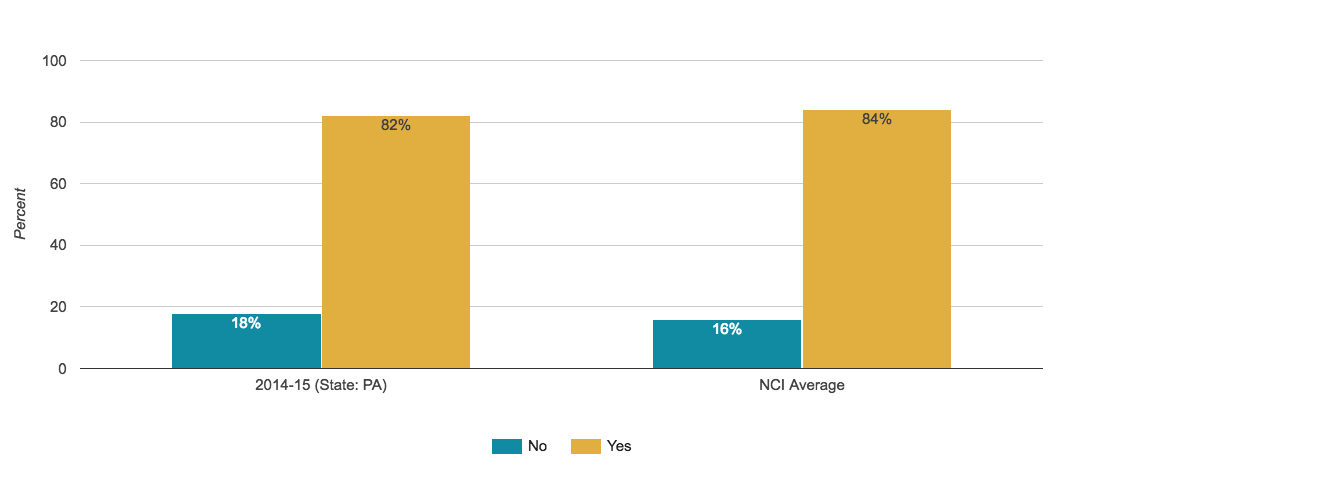
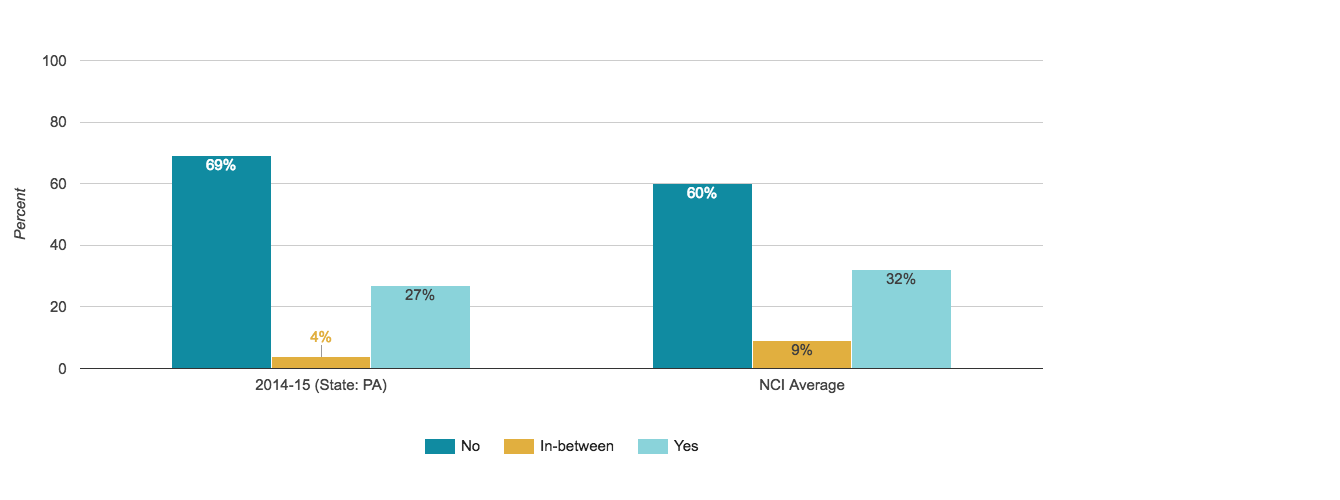
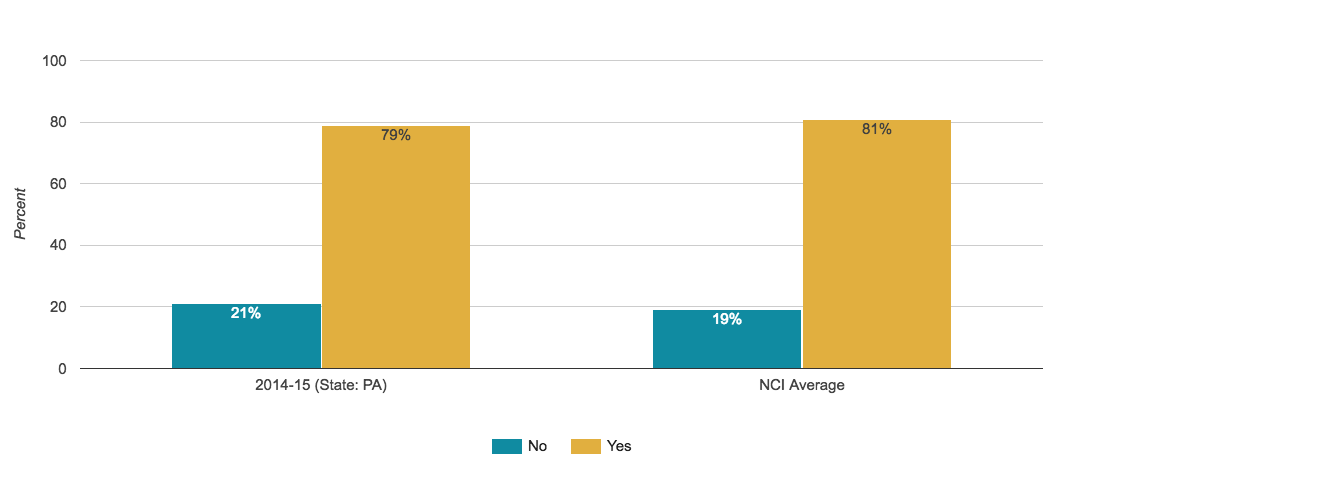
Can Use Phone and Internet Without Restrictions
Proportion of people who reported they can use phone and internet without restriction
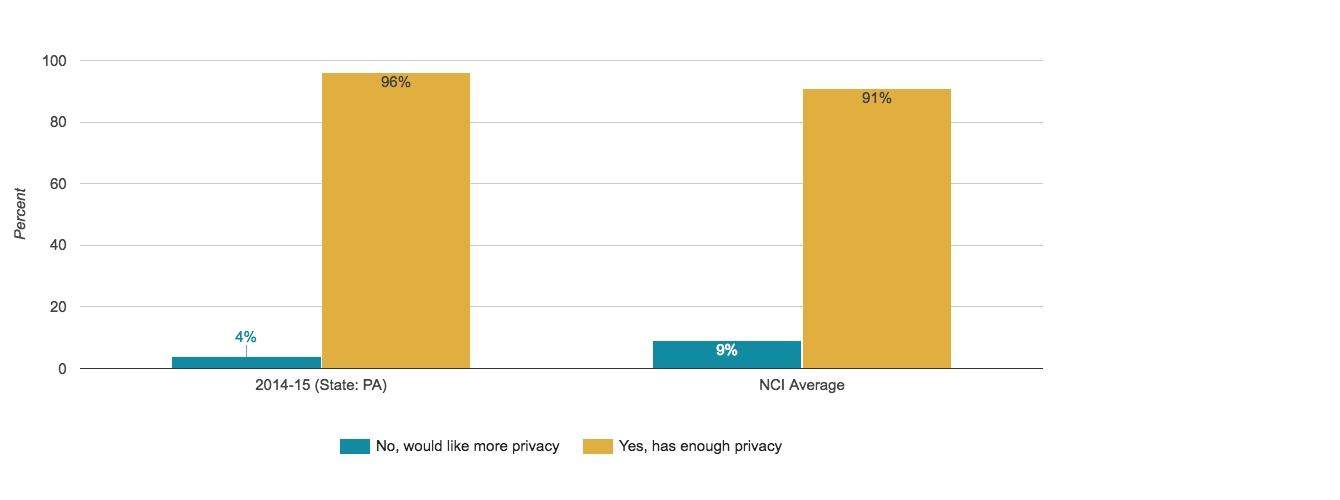
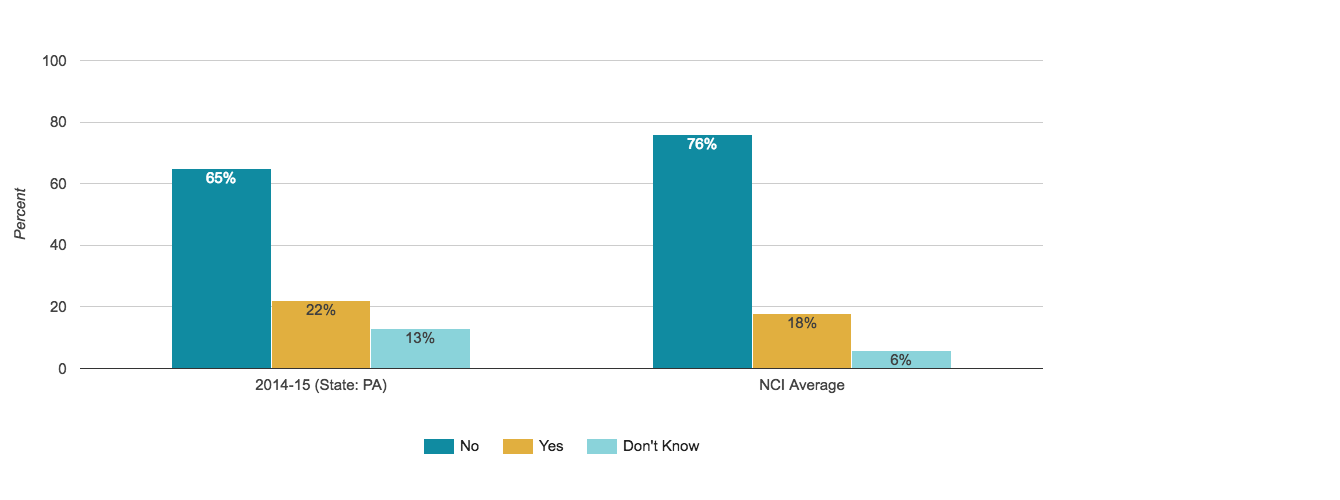
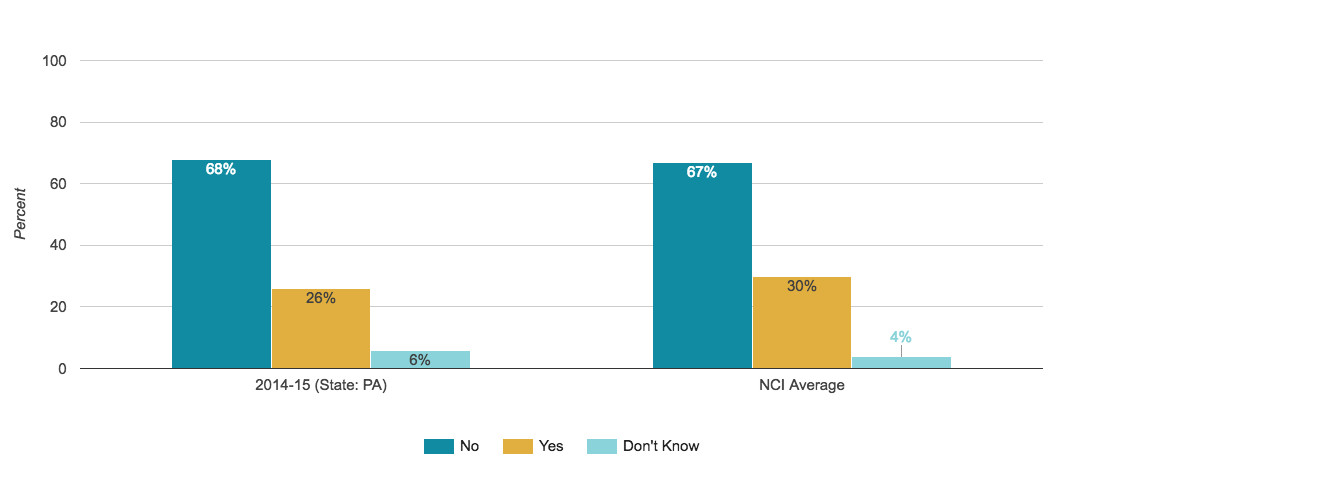
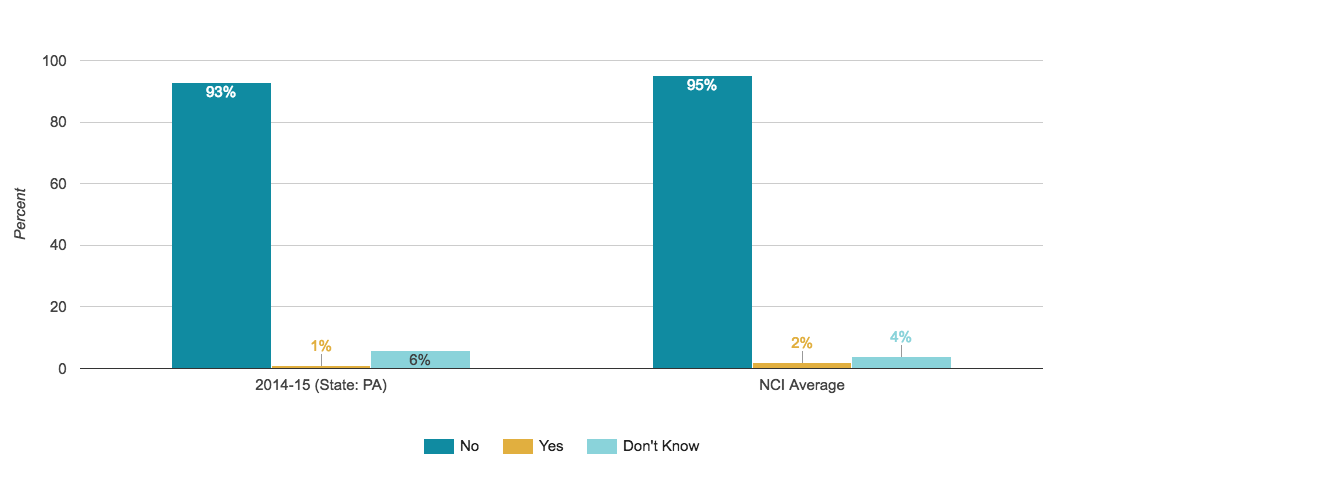
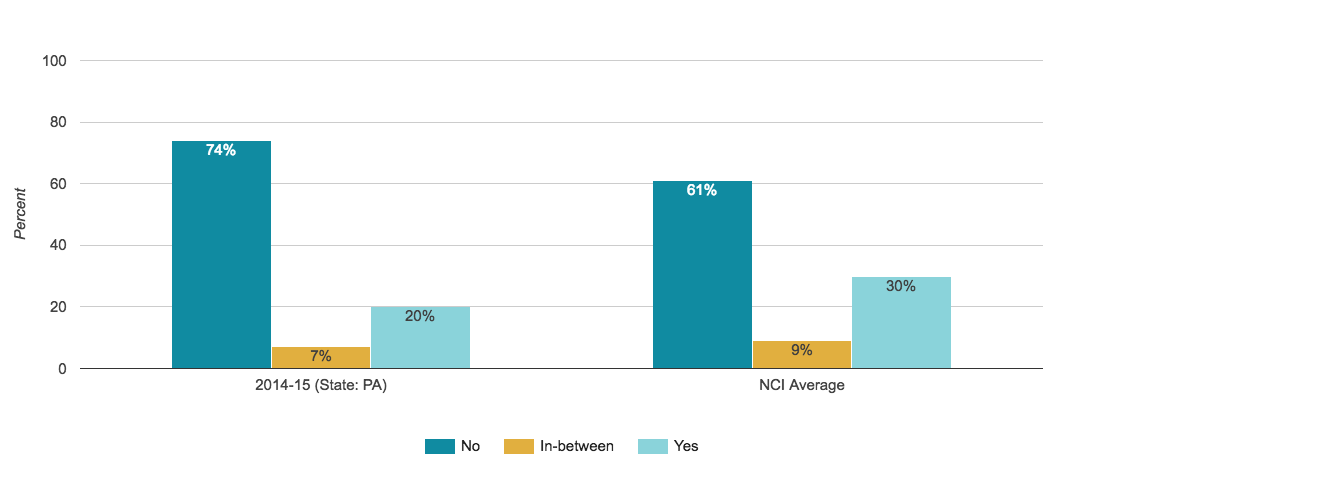
Has Enough Privacy at Home
Proportion of people who reported they have enough privacy at home
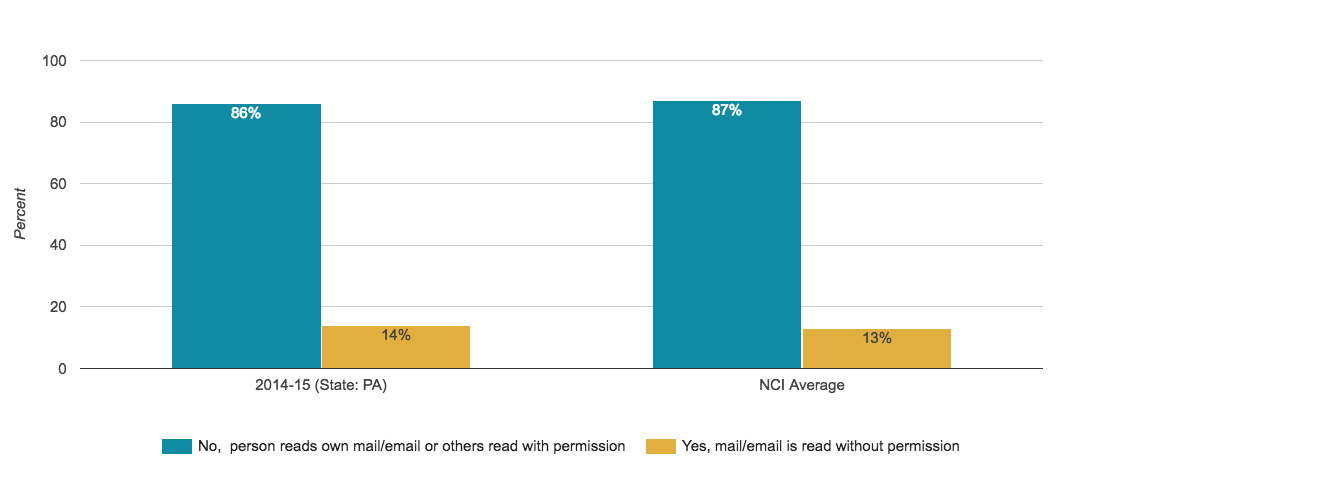
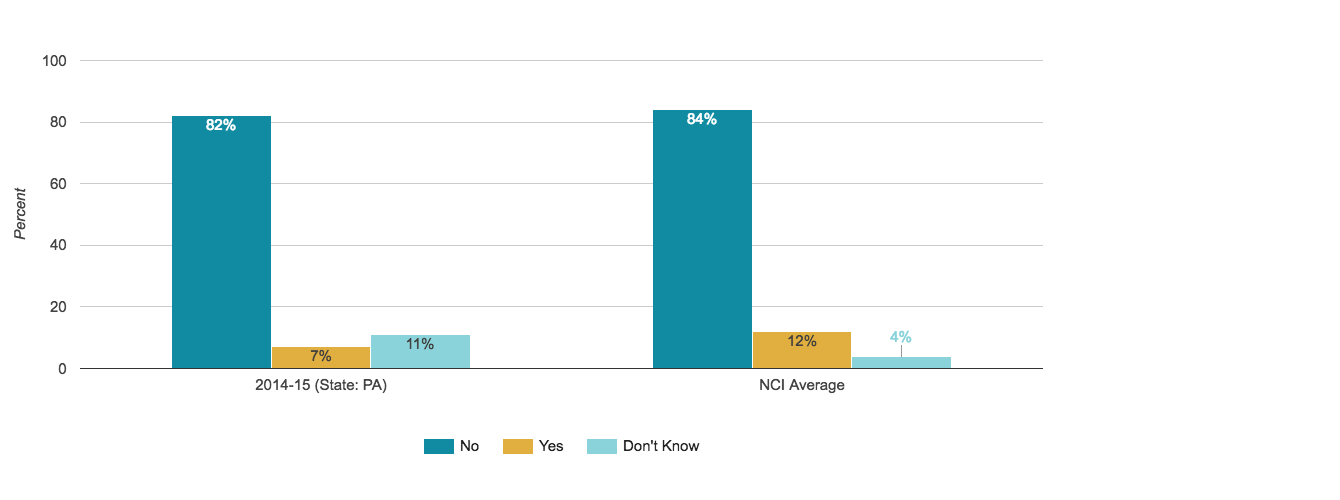
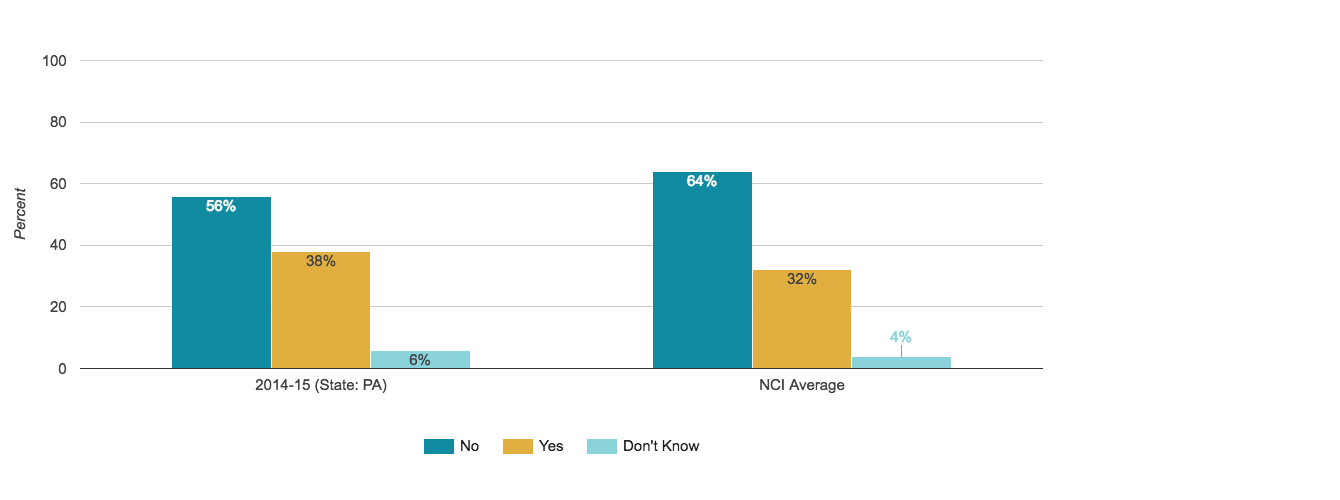
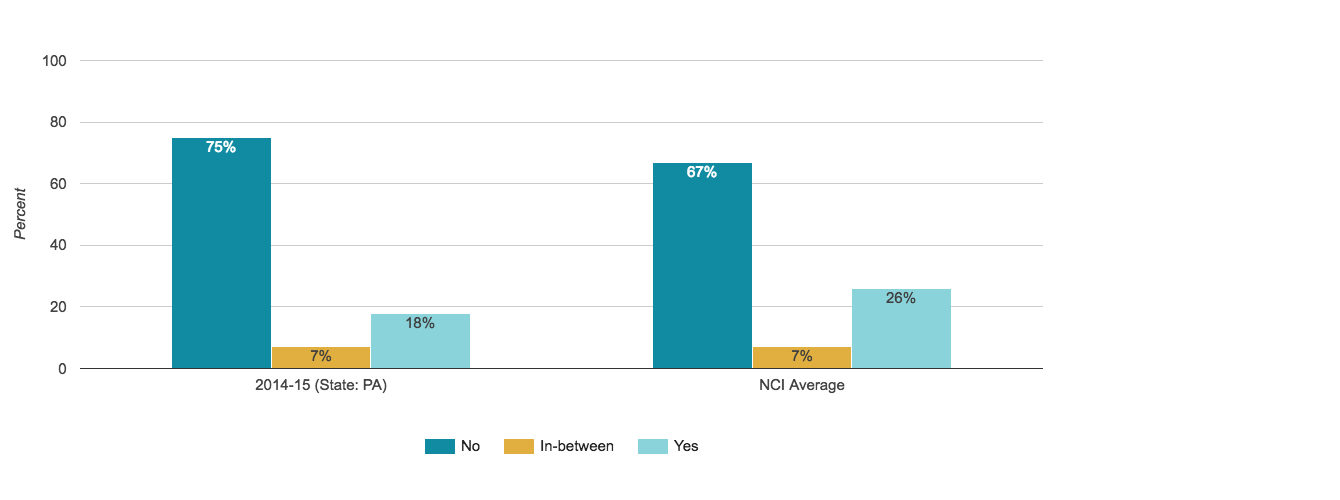
Mail or Email Is Not Read by Others Without Permission
Proportion of people who reported people never read their mail without permission
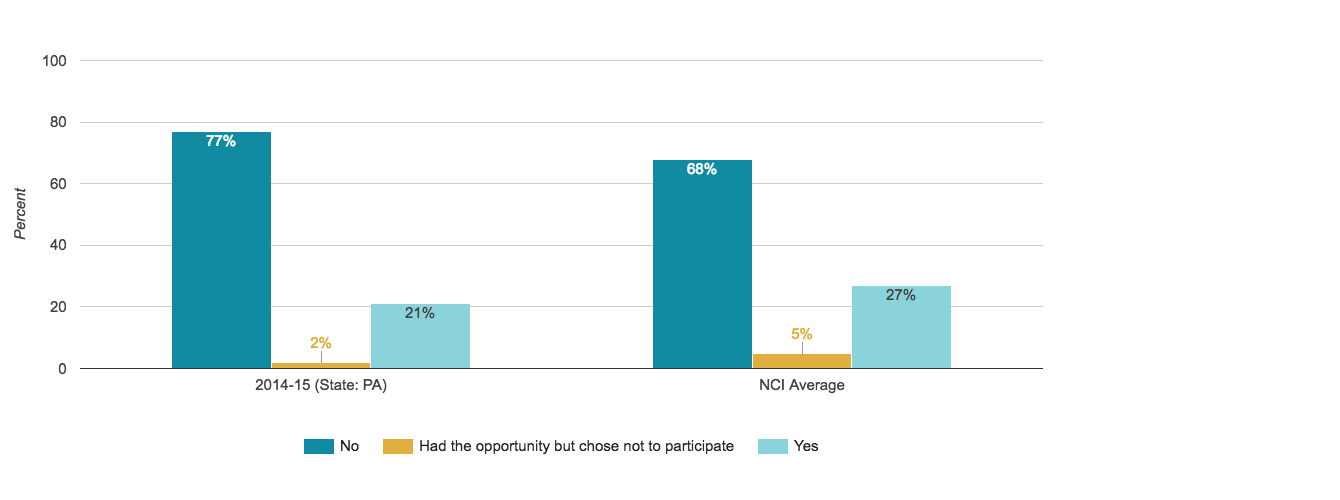
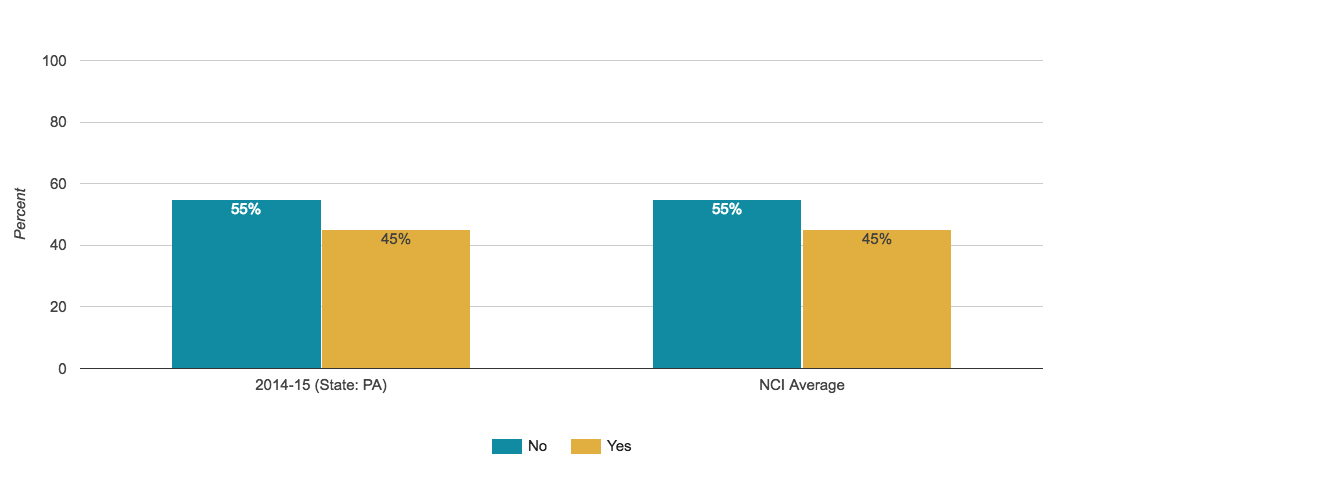
Participated in a Self-Advocacy Meeting, Conference, or Event
Proportion of people who reported they have attended a self advocacy event, or chose not to
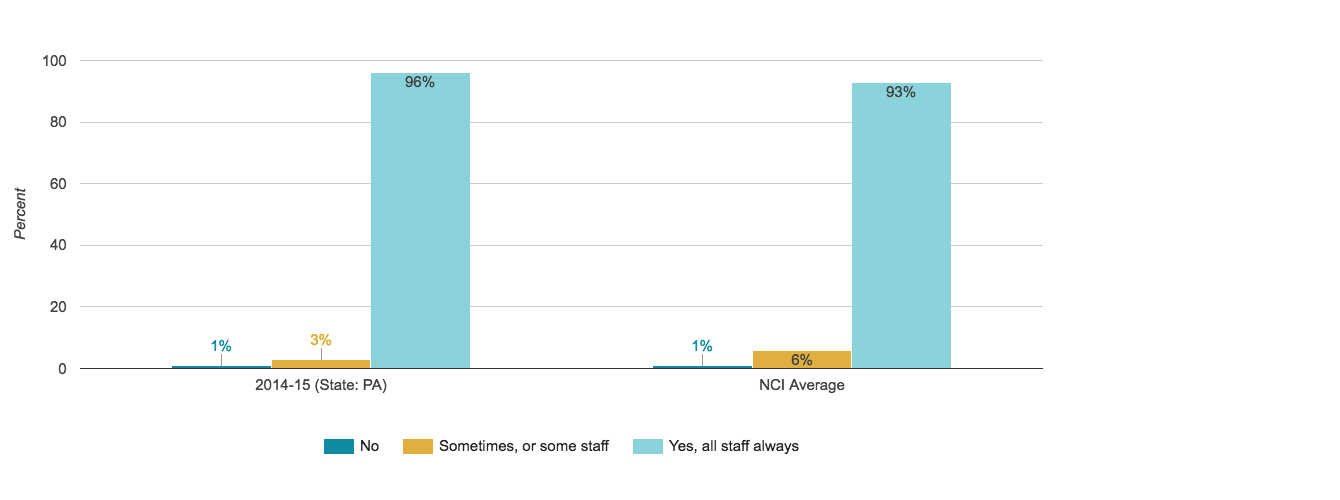
People Let This Person Know Before Entering Their Bedroom
Proportion of people who reported people always knock before entering bedroom
People Let This Person Know Before Entering Their Home
Proportion of people who reported people always knock before entering home
Staff Treats With Respect
Proportion of people who reported their staff treat them with respect
Safety
People are safe from abuse, neglect, and injury.
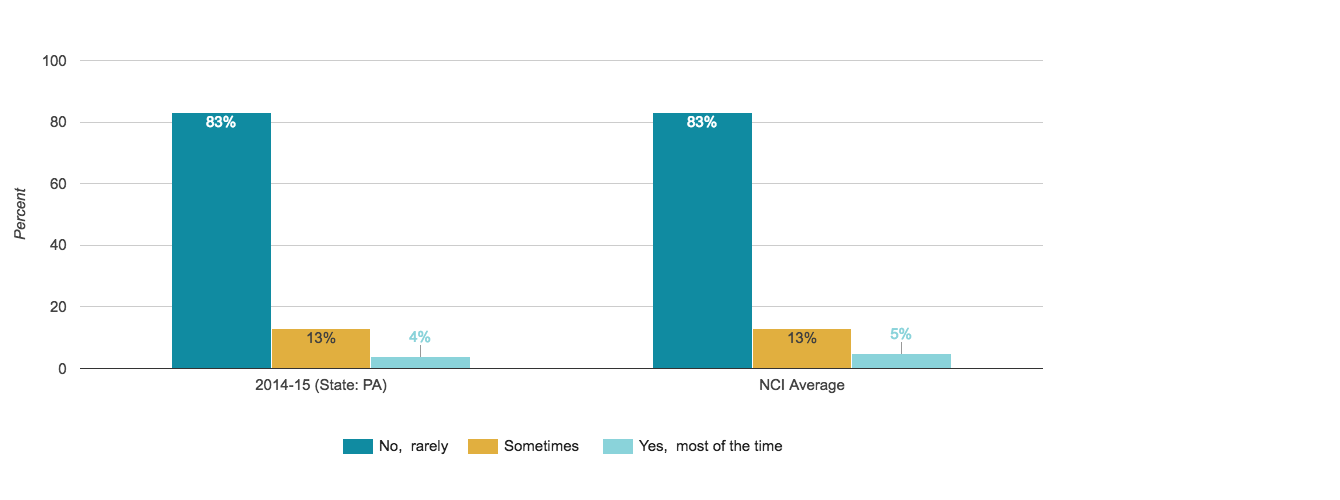
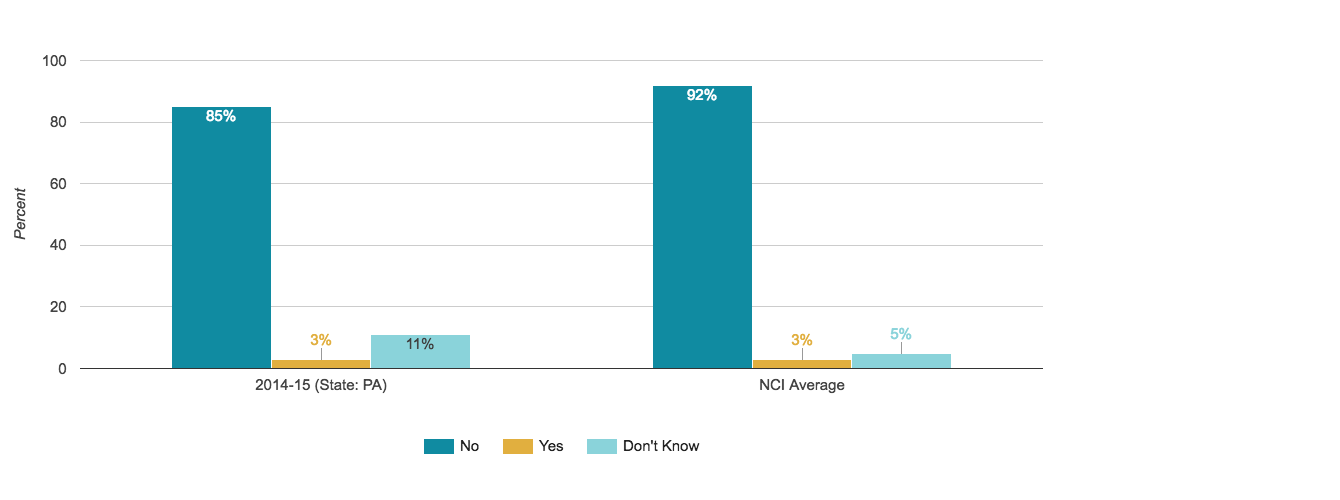
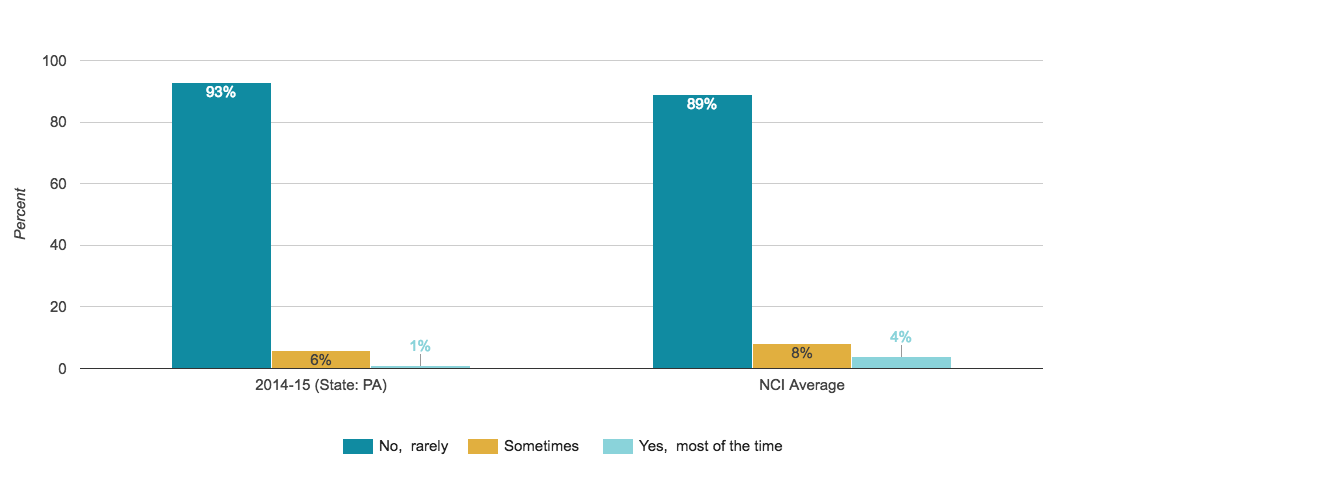
Ever Feel Afraid or Scared at Home
Proportion of people who reported they never feel scared or afraid in their home
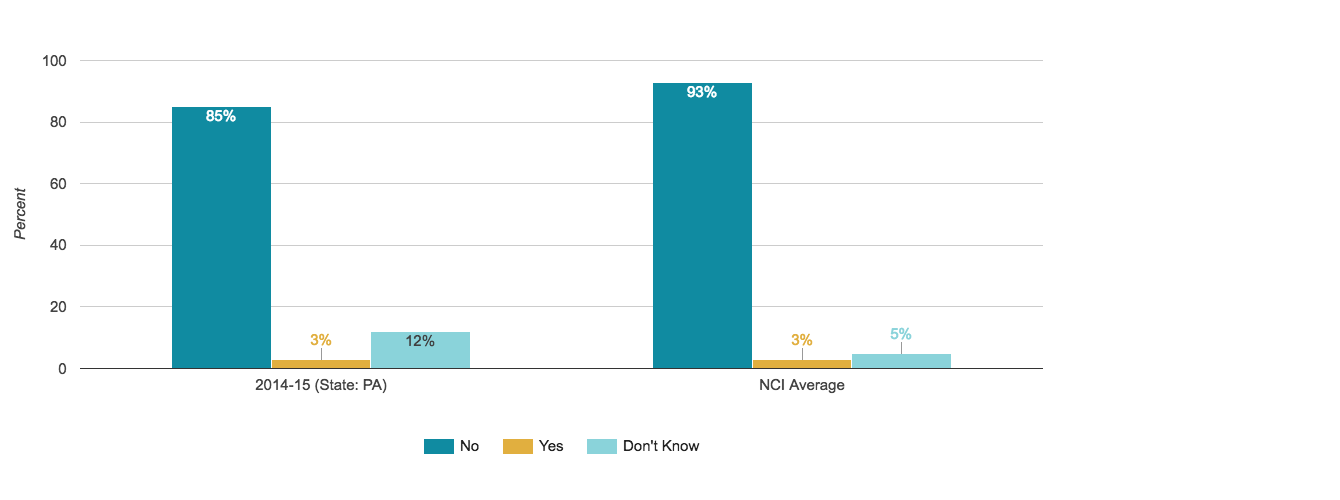
Ever Feel Afraid or Scared at Work, Day Program, or Regular Activity
Proportion of people who reported they never feel scared or afraid at their work or day program/regular activity
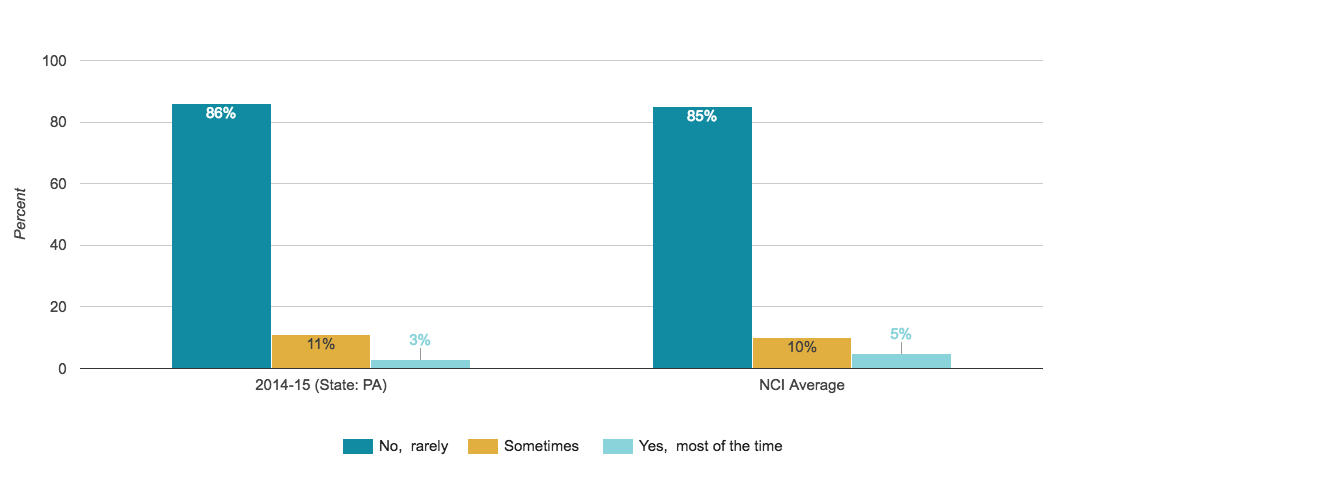
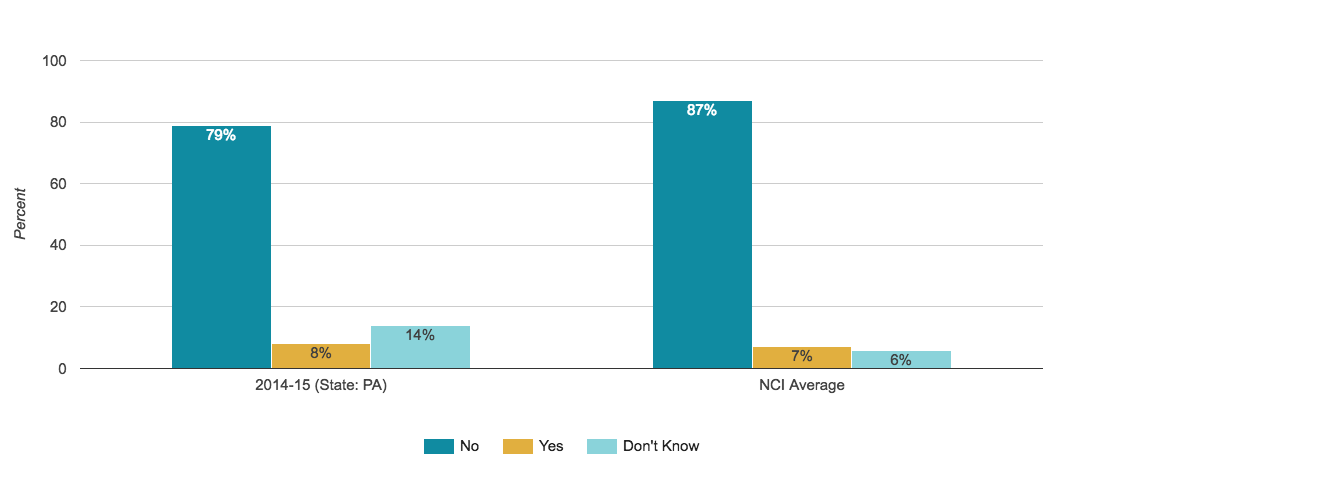
Ever Feel Afraid or Scared in Neighborhood
Proportion of people who reported they never feel scared or afraid in their neighborhood
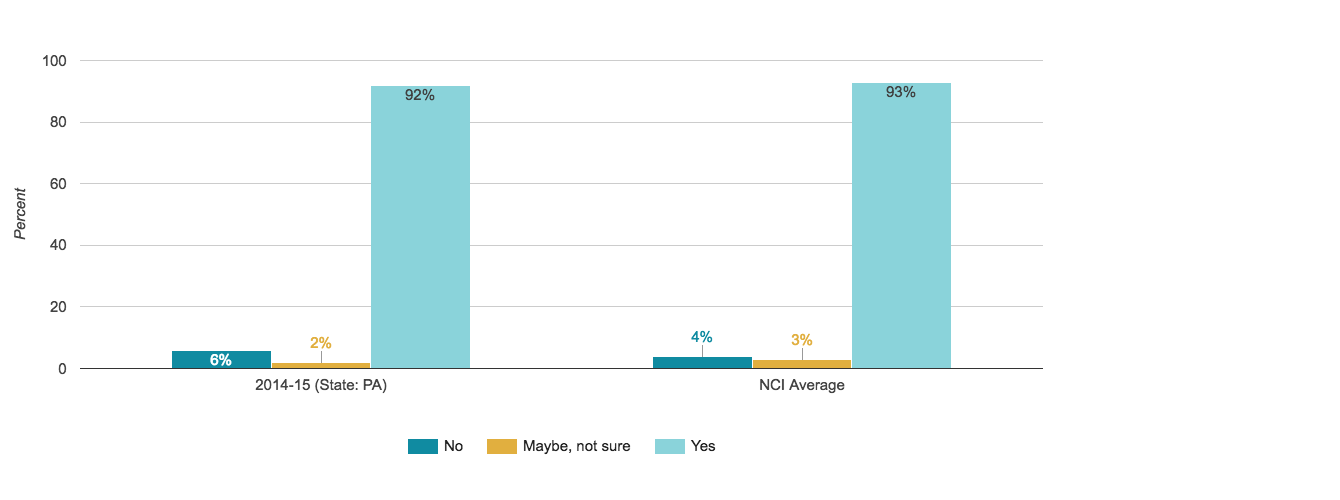
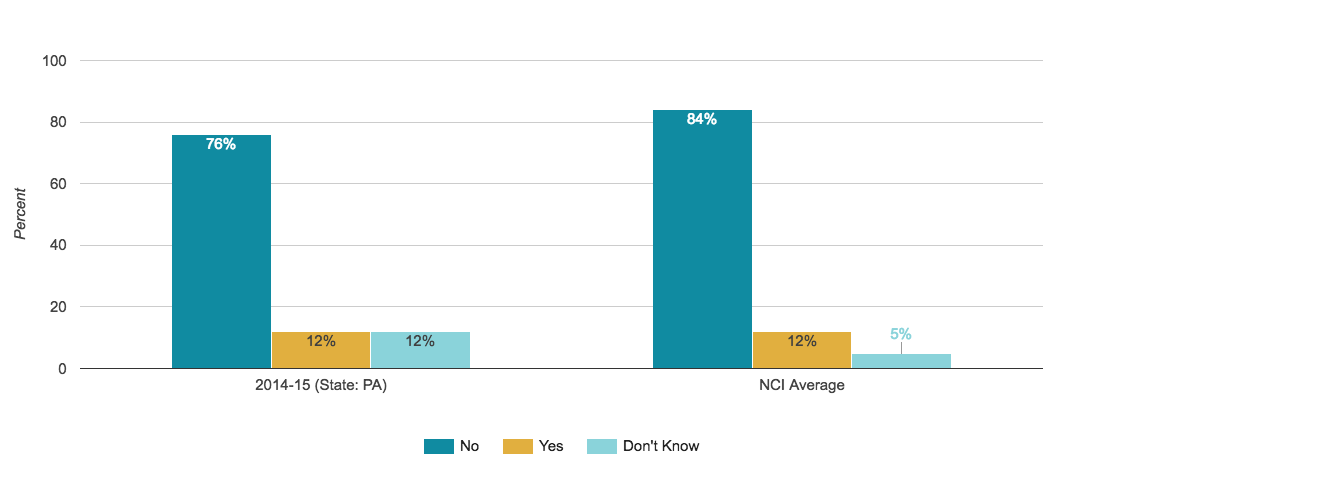
Someone to Go to for Help If Afraid
Proportion of people who reported they have someone to go to for help if they feel scared
Wellness
People are supported to maintain healthy habits.
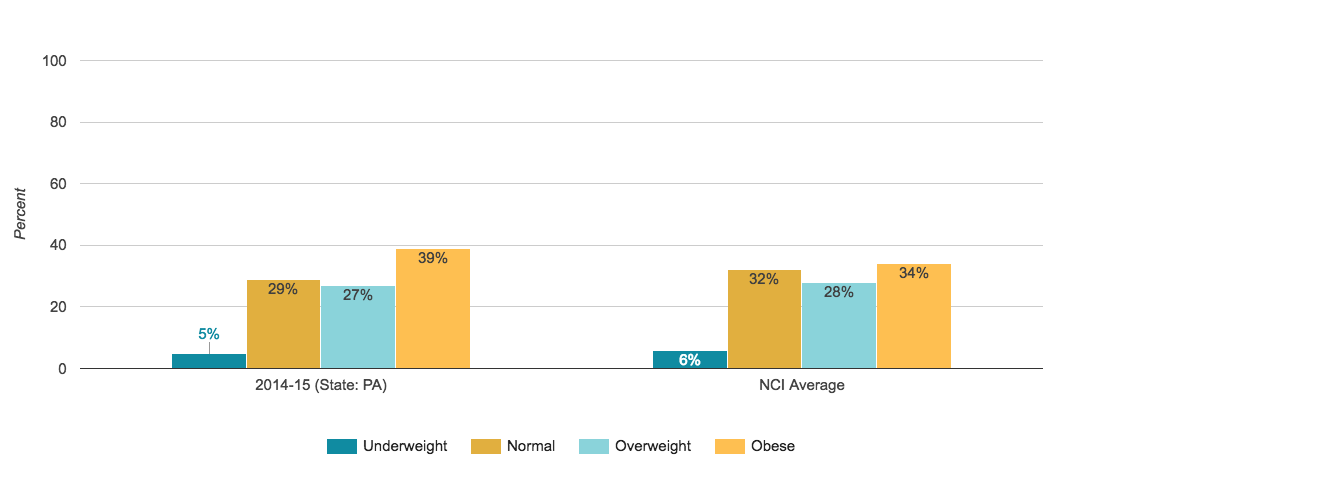
BMI (Body Mass Index)
Proportion of people in each BMI category
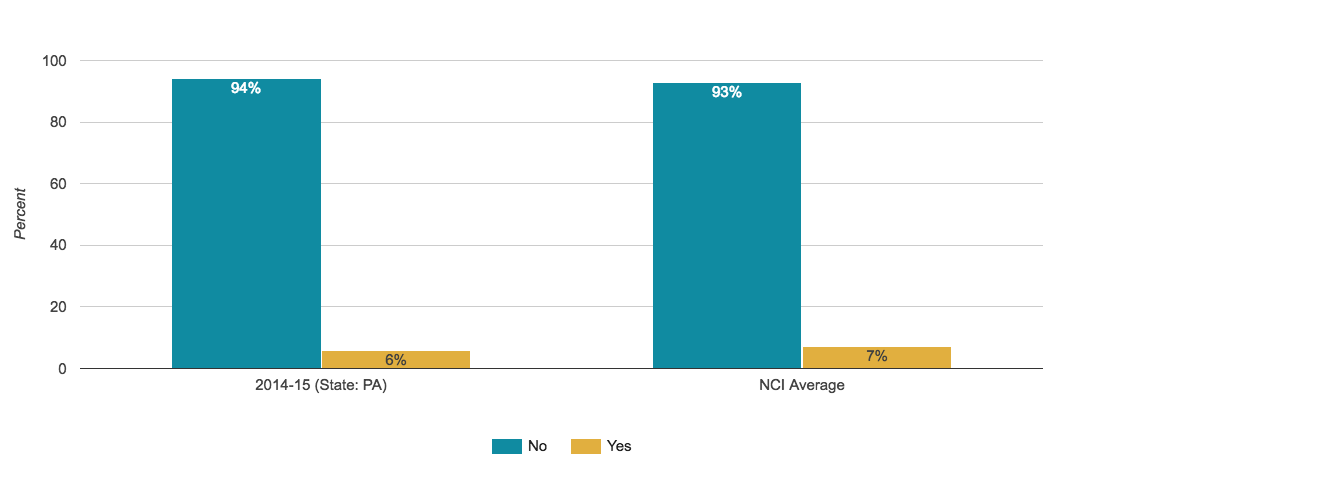
Chews or Smokes Tobacco
Proportion of people who were reported to chew or smoke tobacco
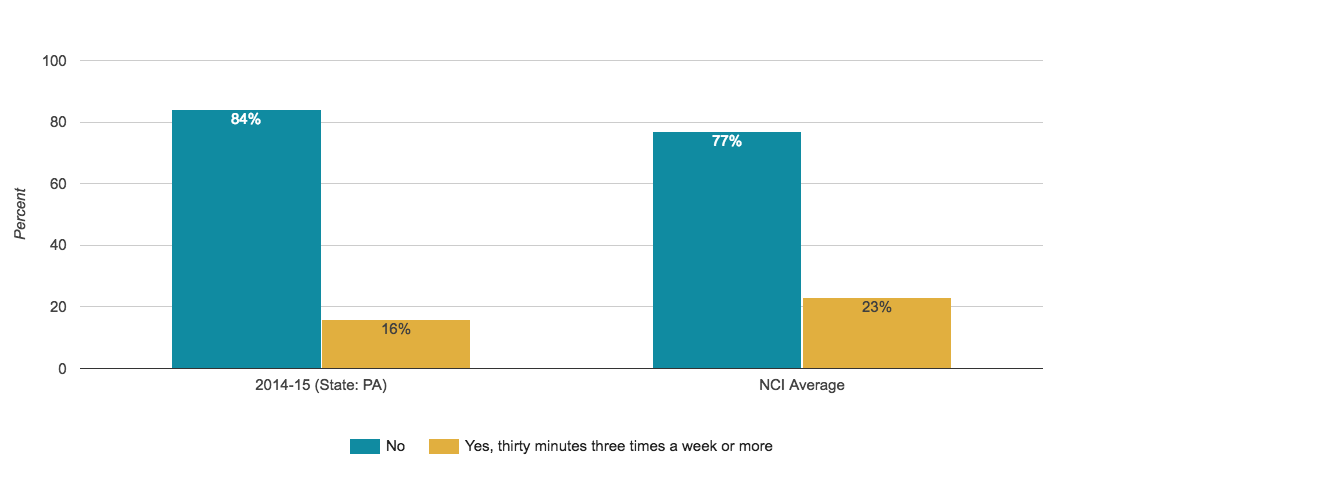
Engages in Regular, Moderate Physical Activity
Proportion of people who were reported to engage in regular physical activity (at least 30 minutes 3 times a week)
Choice and Decision-Making
People make choices about their lives and are actively engaged in planning their services and supports.
Chooses How to Spend Money
Proportion of people who reported they chose or help decide what to buy with their spending money
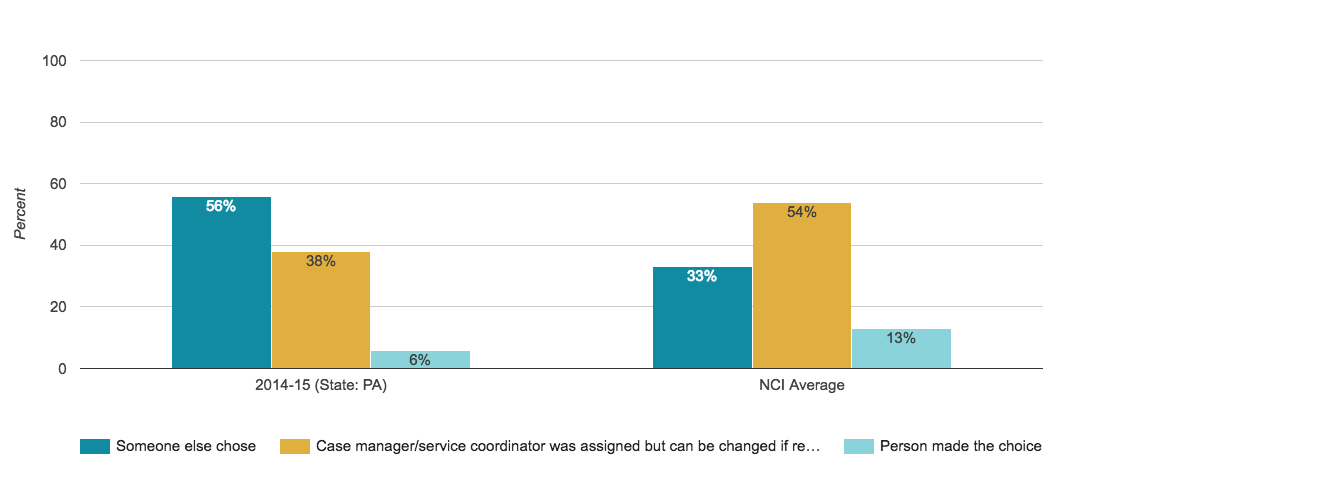
Chose Case Manager/Service Coordinator
Proportion of people who reported they chose or were aware they could request to change their case manager/service coordinator
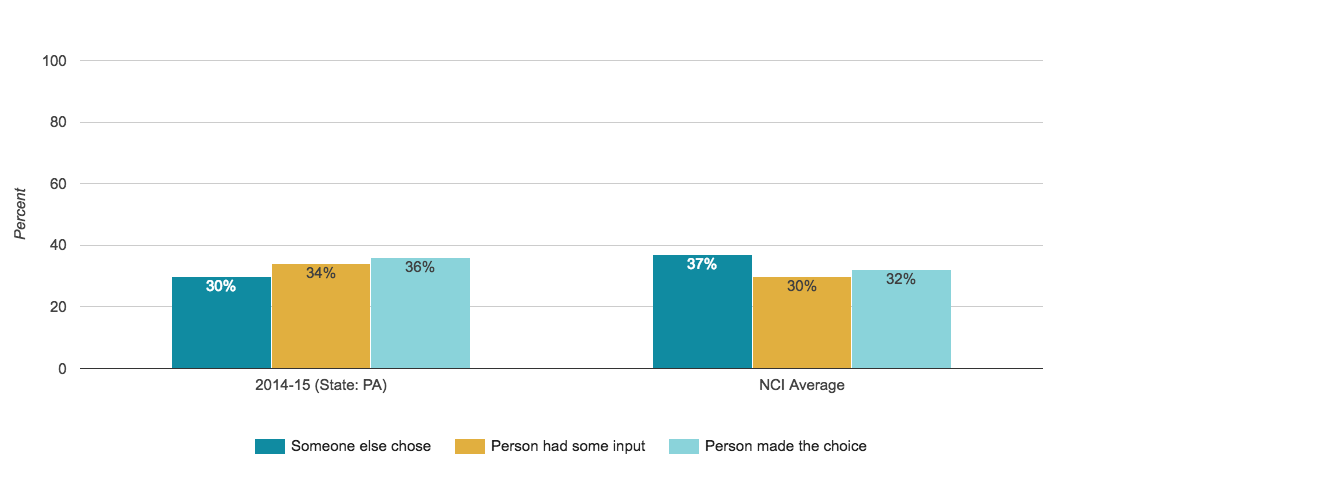
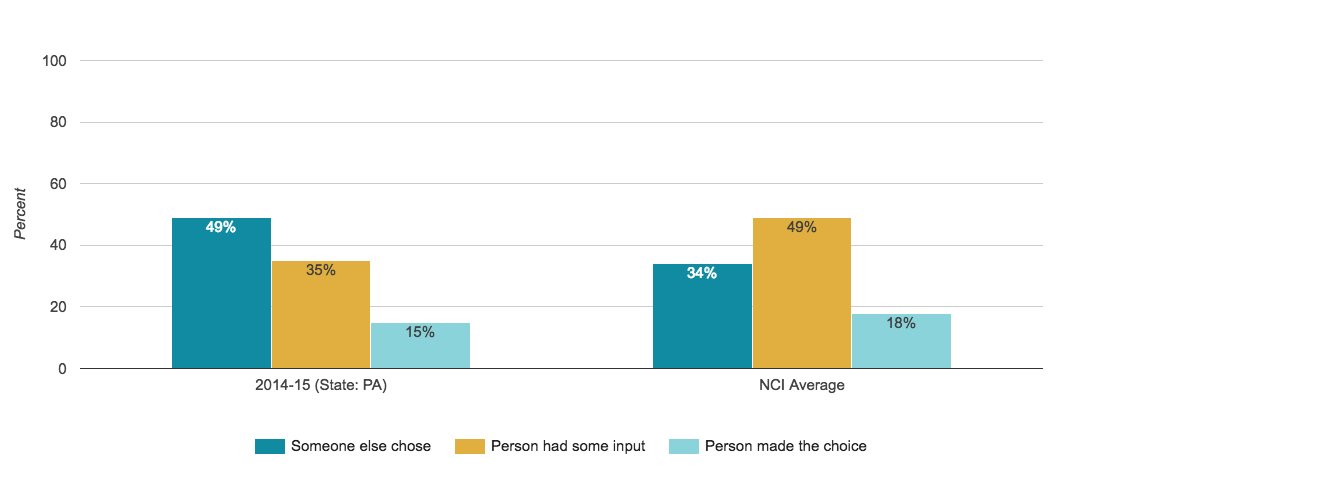
Chose Day Program or Regular Activity
Proportion of people who reported they have a day program or activity and chose or had some input in choosing their day program or activity
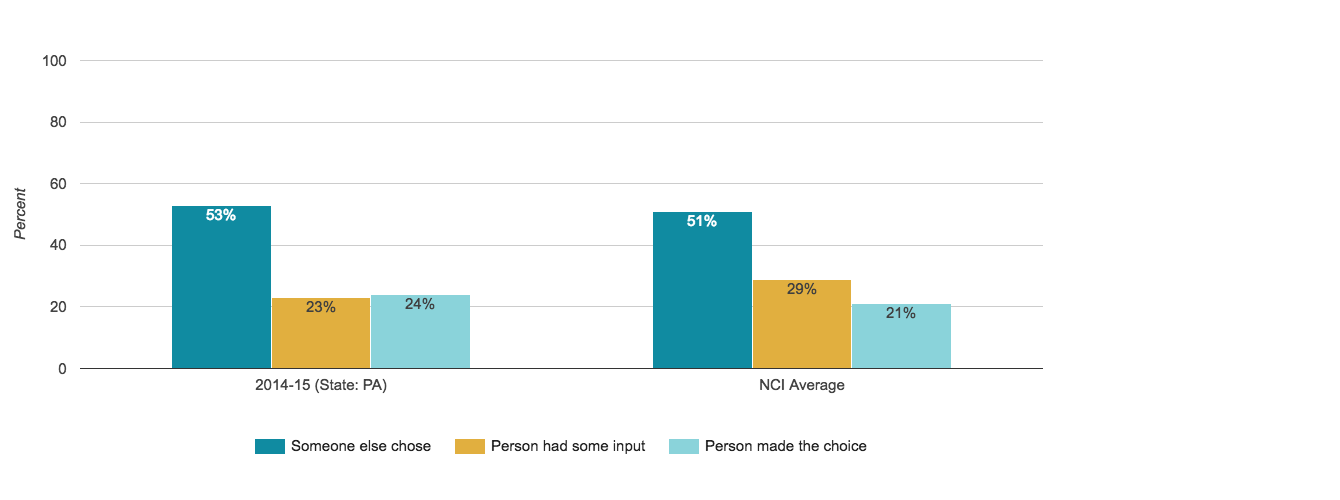
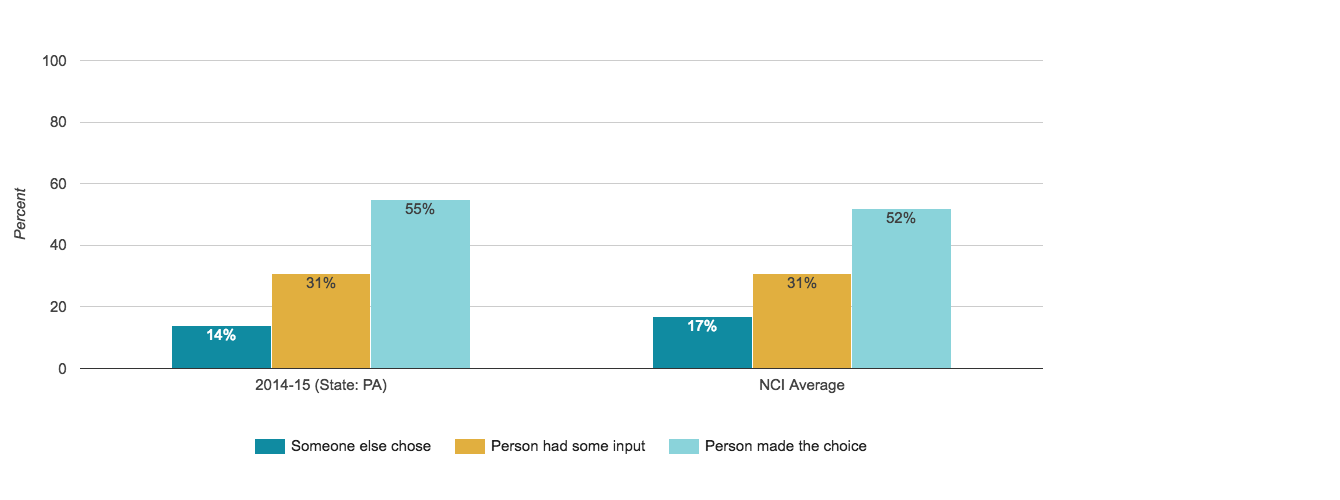
Chose Home
Proportion of people who reported they chose or had some input in choosing where they live if not living in the family home
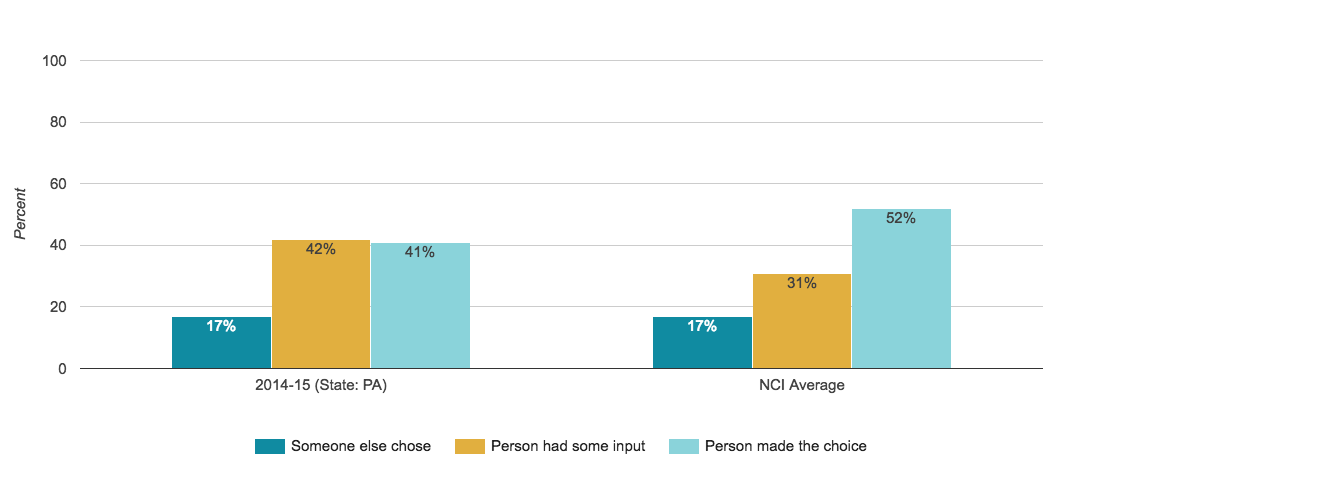
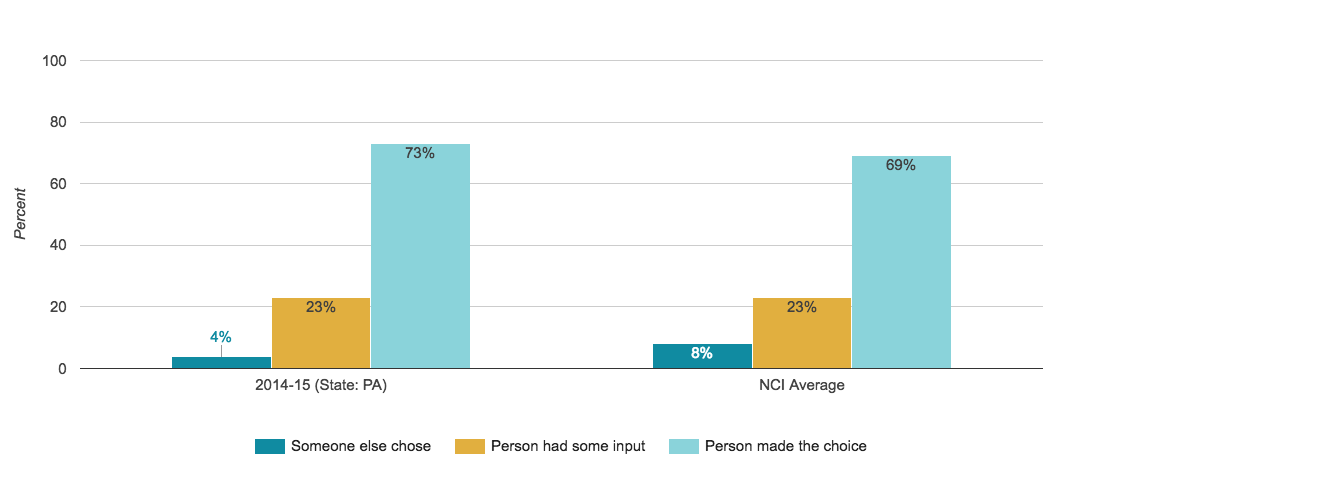
Chose Paid Community Job
Proportion of people reported to have a job in the community and who reported they chose or had some input in choosing their job*
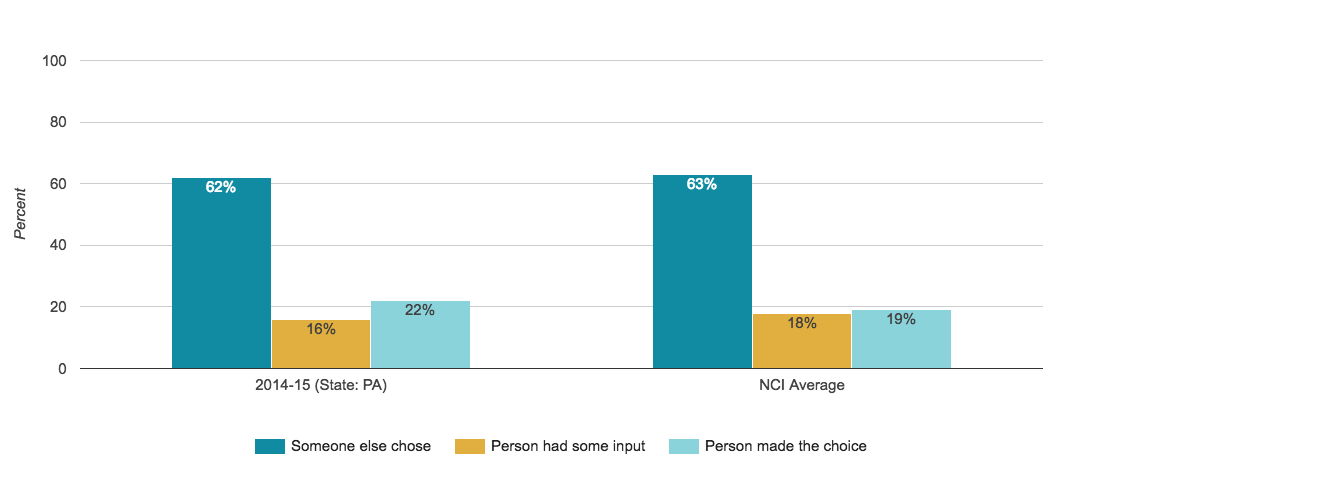
Chose Roommates
Proportion of people who reported they chose or had some input in choosing their roommates if not living in the family home
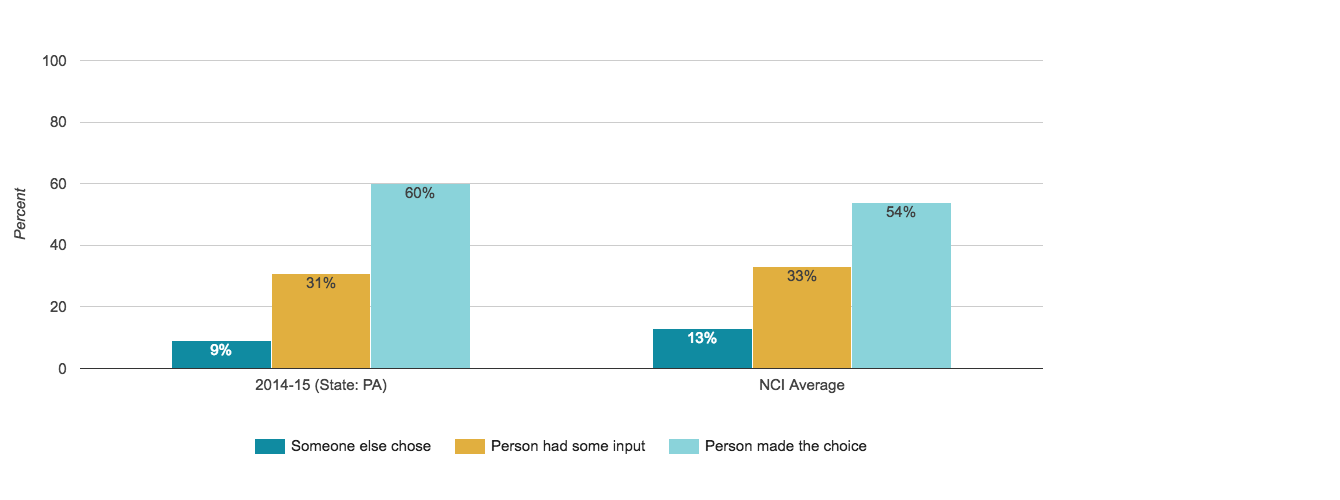
Chose Staff
Proportion of people who reported they chose or were aware they could request to change their staff
Decides Daily Schedule
Proportion of people who reported they choose or help decide their daily schedule
Decides How to Spend Free Time
Proportion of people who reported they choose or help decide how to spend free time
Community Inclusion
People have support to participate in everyday community activities.
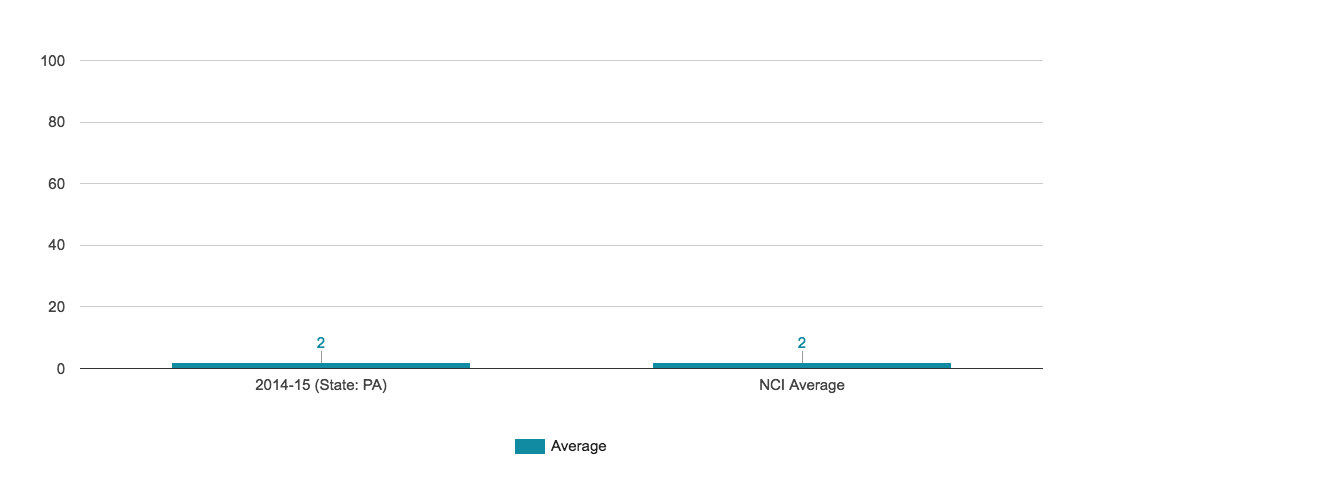
Average Times Went On Vacation in the Past Year
The proportion of people who regularly participate in everyday integrated activities in their communities.
Average Times Went Out for Entertainment in the Past Month
The proportion of people who regularly participate in everyday integrated activities in their communities.

Average Times Went Out for Exercise in the Past Month
The proportion of people who regularly participate in everyday integrated activities in their communities.
Average Times Went Out on Errands in the Past Month
The proportion of people who regularly participate in everyday integrated activities in their communities.
Average Times Went Out Shopping in the Past Month
The proportion of people who regularly participate in everyday integrated activities in their communities.
Average Times Went Out to Eat in the Past Month
The proportion of people who regularly participate in everyday integrated activities in their communities.

Average Times Went Out to Religious or Spiritual Service in the Past Month
The proportion of people who regularly participate in everyday integrated activities in their communities.
Went On Vacation in the Past Year
The proportion of people who regularly participate in everyday integrated activities in their communities.
Went Out for Entertainment in the Past Month
The proportion of people who regularly participate in everyday integrated activities in their communities.
Went Out for Exercise in the Past Month
The proportion of people who regularly participate in everyday integrated activities in their communities.
Went Out on Errands in the Past Month
The proportion of people who regularly participate in everyday integrated activities in their communities.
Went Out Shopping in the Past Month
The proportion of people who regularly participate in everyday integrated activities in their communities.
Went Out to a Religious or Spiritual Service in the Past Month
The proportion of people who regularly participate in everyday integrated activities in their communities.
Went Out to Eat in the Past Month
The proportion of people who regularly participate in everyday integrated activities in their communities.
Relationships
People have friends and relationships.
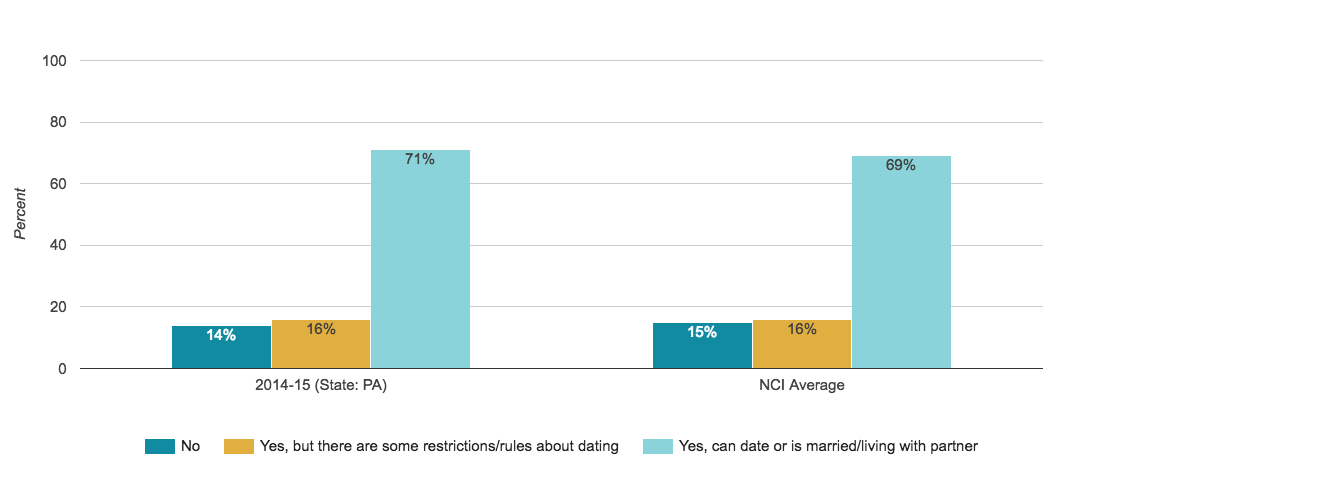
Can Go on a Date When Wants
Proportion of people who reported they can go on a date if they want to or can date with some restriction
Can Help Other People
Proportion of people who reported they can help other people if they want to at least some of the time
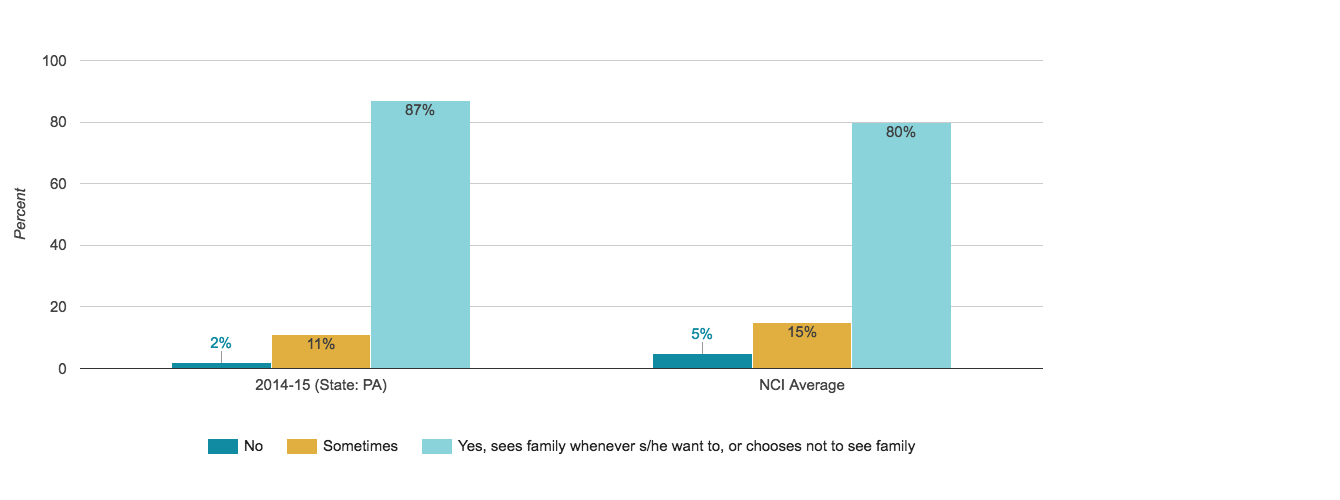
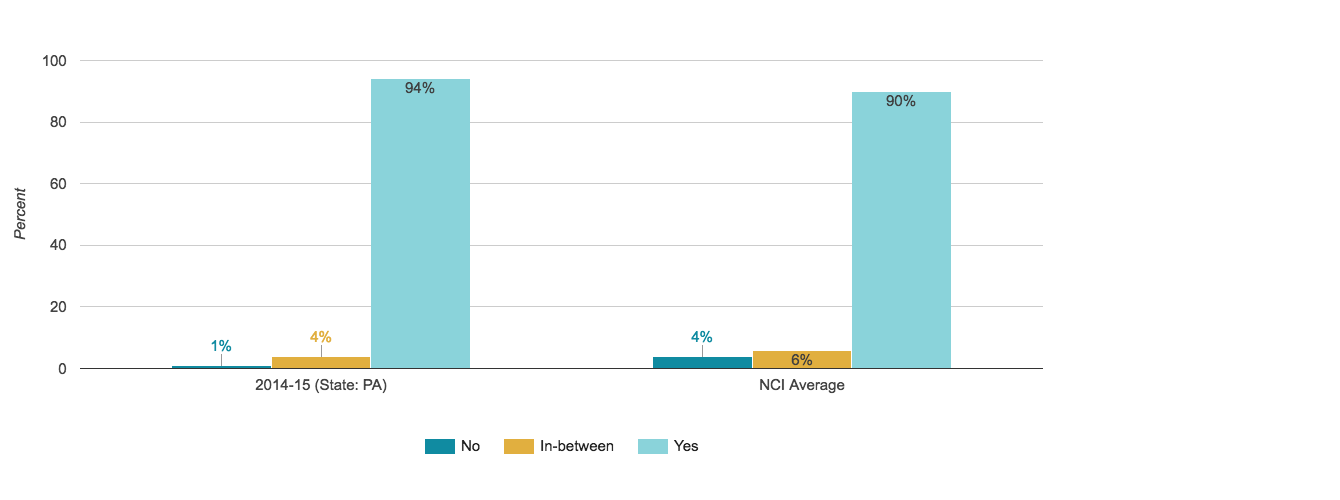
Can See Family When Wants
Proportion of people who reported they have family they see and the support needed to see their family when they want to
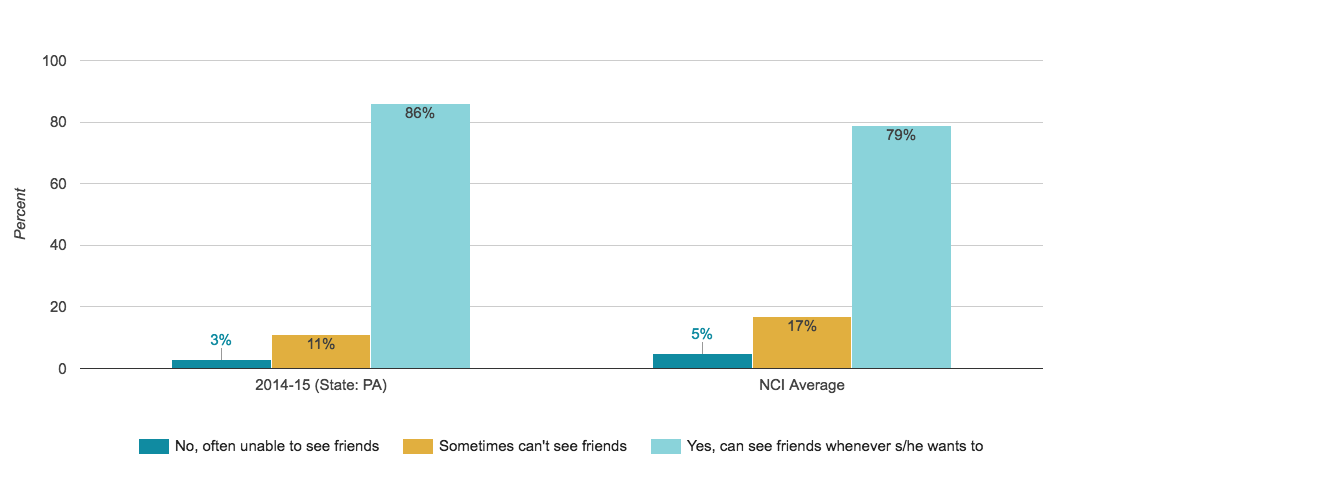
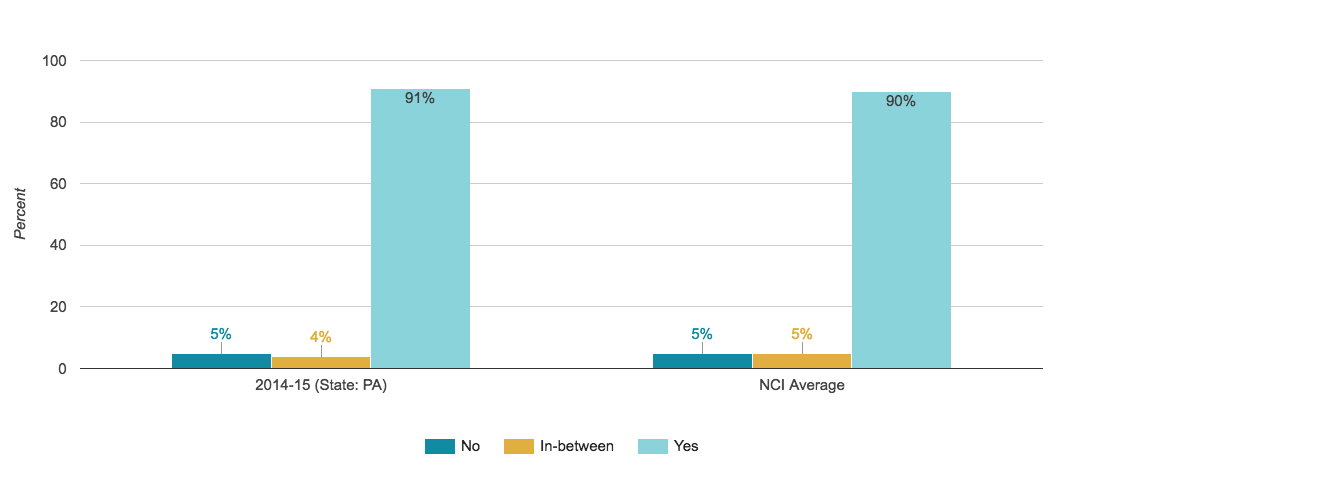
Can See Friends When Wants
Proportion of people who reported they have friends (may be staff or family) and the support needed to see their friends when they want to
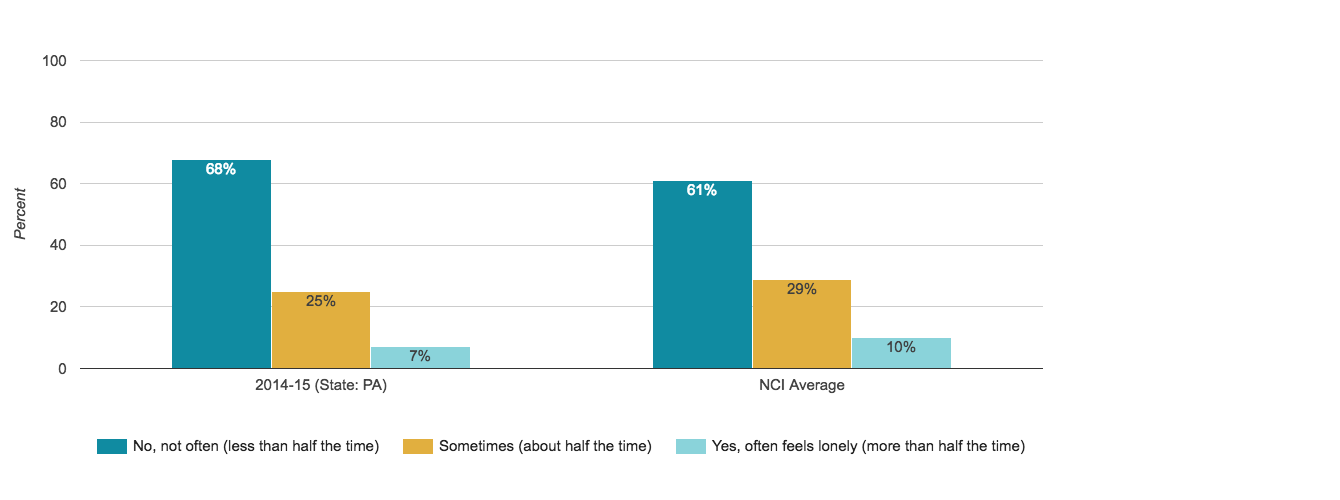
Feels Lonely
Proportion of people who reported they feel lonely at least half the time
Has a Best Friend
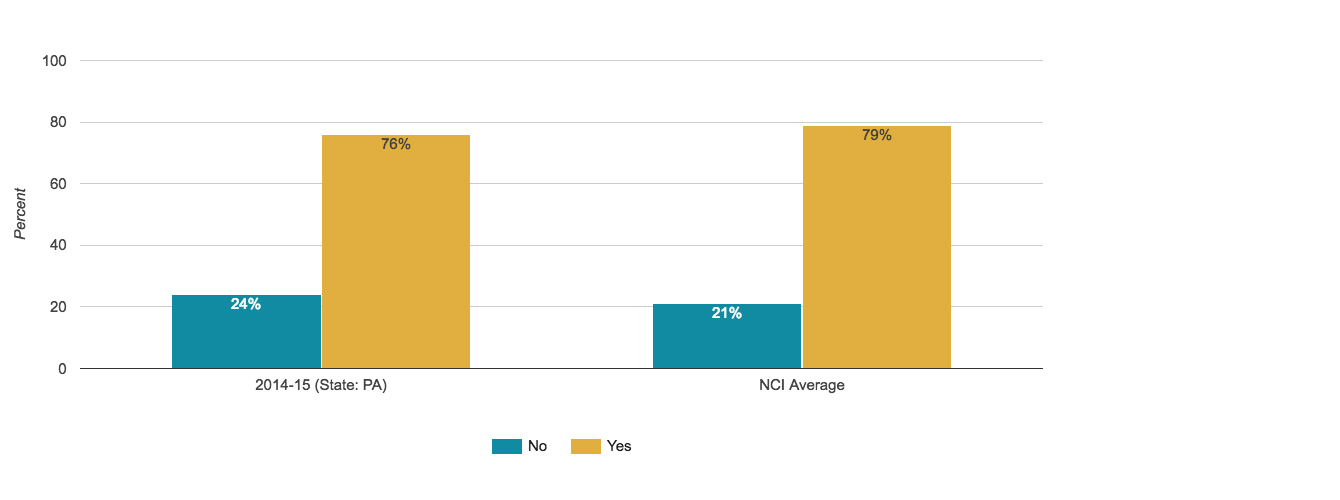
Proportion of people who reported they have a best friend
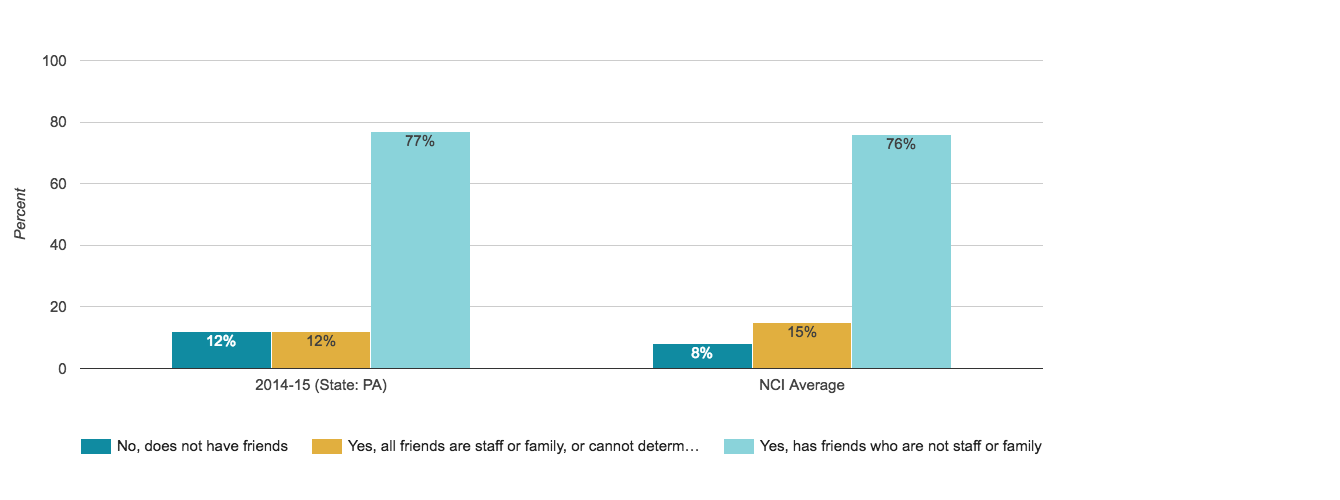
Has Friends
Proportion of people who reported they have friends who are not staff or family members
Satisfaction
People are satisfied with the services and supports they receive.
Families/family members with disabilities receive adequate and satisfactory supports.
Likes Day Program or Regular Activity
Proportion of people who reported they attend a day program or activity and like their day program or activity
Likes Home
Proportion of people who reported they like their home
Likes Paid Community Job
Proportion of people who were reported to have a job in the community and who reported they like where they work
Wants to Go Somewhere Else or Do Something Else During the Day
Proportion of people who reported they attend a day program or activity and want to go or do something different during the day
Wants to Live Somewhere Else
Proportion of people who reported they would like to live somewhere else
Wants to Work Somewhere Else
Proportion of people who were reported to have a job in the community and who reported they want to work somewhere else
Self-Determination
People have authority and are supported to direct and manage their own services.
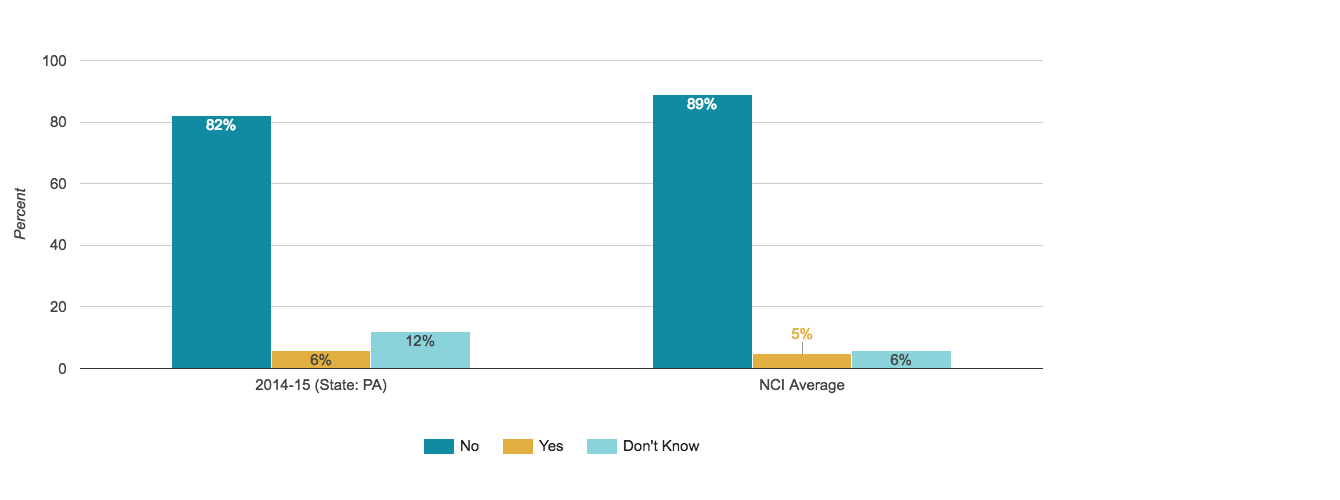
Uses Self-Directed Supports
Proportion of people who were reported to be using a self-directed supports option
Work
People have support to find and maintain community integrated employment.
Attends a Day Program or Regular Activity
Proportion of people who reported going to a day program or regular activity
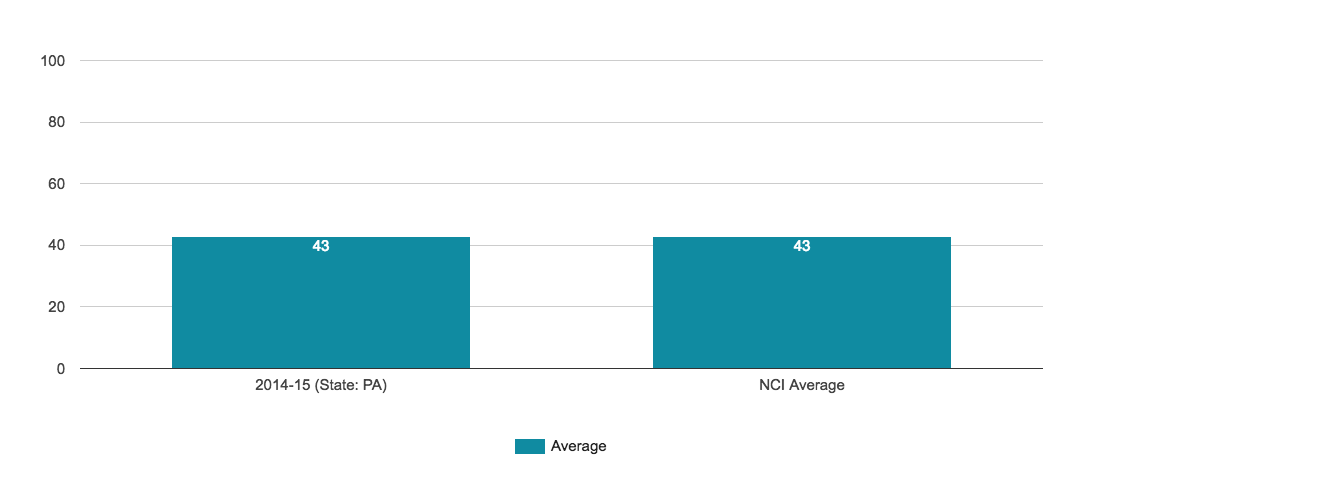
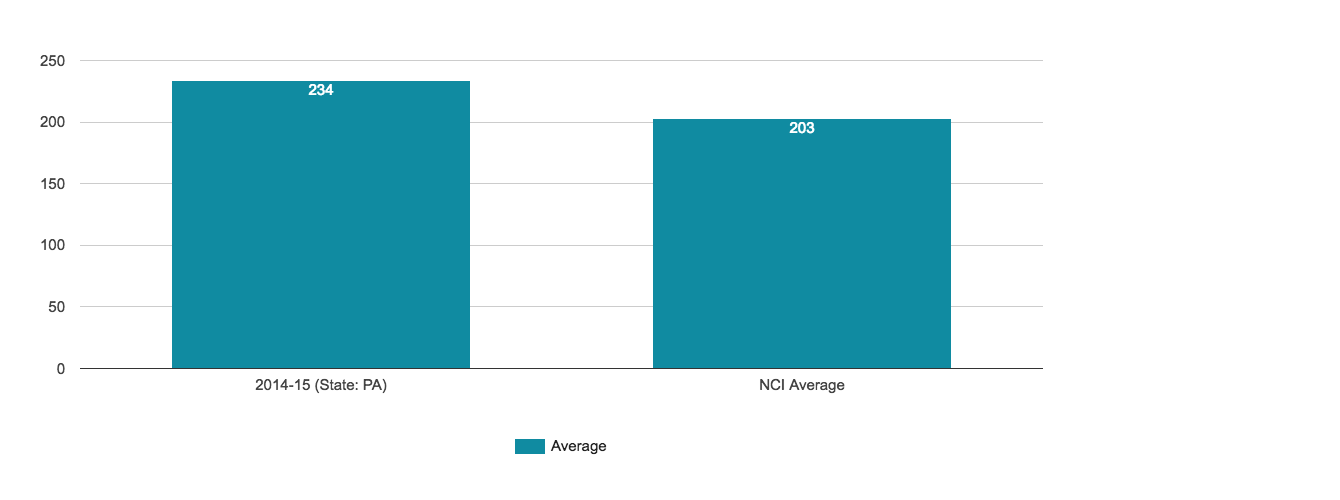
Average Months of Employment at Current Paid Community Job
Average length of employment in current job for people who were reported to have a job in the community
Has Community Employment as a Goal in Service Plan
Proportion of people who were reported to have community employment as a goal in their service plan
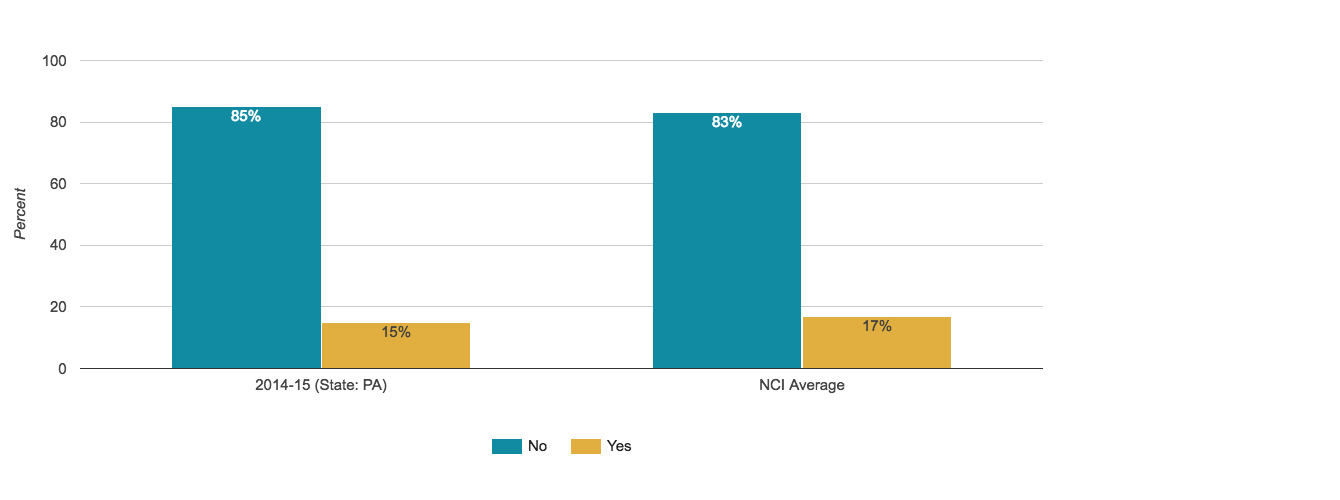
Paid Community Job
Proportion of people who were reported to have a job in the community
Paid Community Job Gross Wages
Average bi-weekly gross wages by type of community employment support

Paid Community Job Hourly Wage
Average bi-weekly hourly wage by type of community employment support
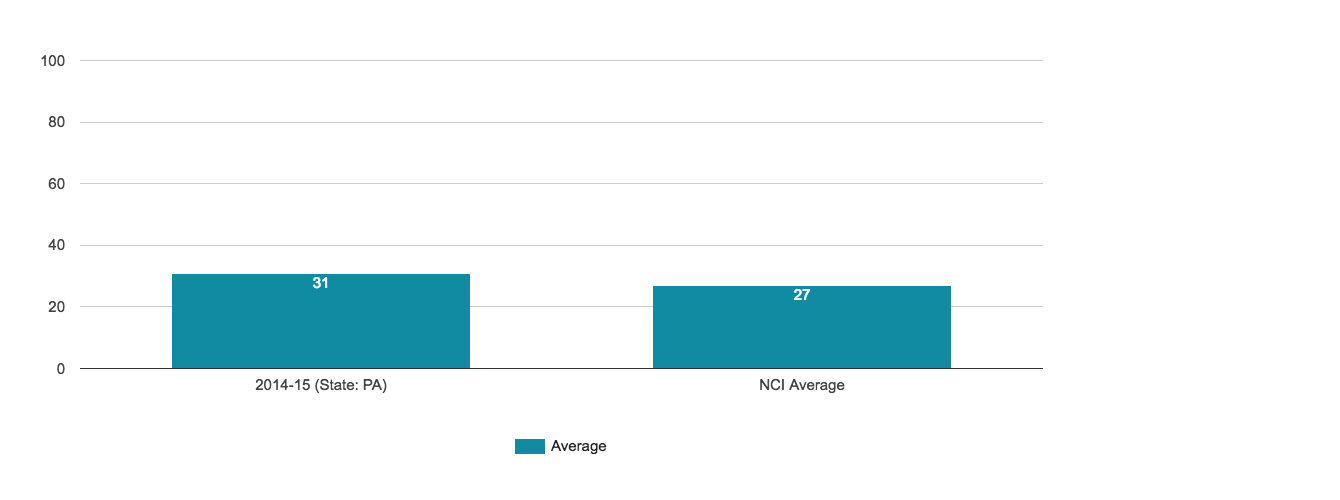
Paid Community Job Hours
Average number of bi-weekly hours by type of community employment support
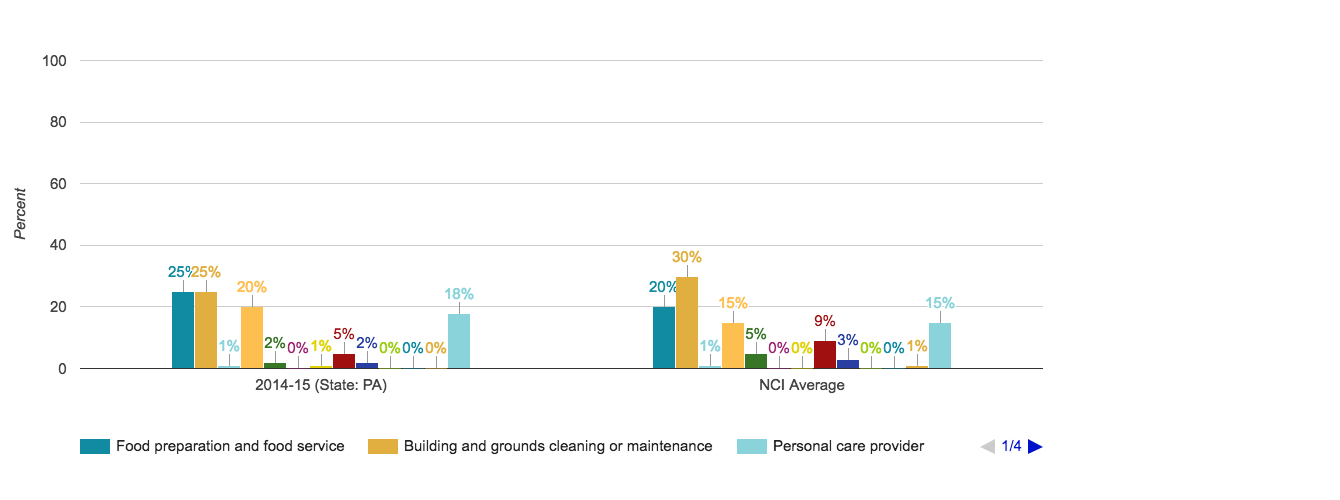
Paid Community Job Industry
Proportion of people who were reported to have a job in the community in different types of jobs
Receives Paid Vacation and/or Sick Time at Paid Community Job
Proportion of people who were reported to have a job in the community and received paid vacation and/or sick time at their job

Type of Paid Community Job
Proportion of people who were reported to have a job in the community by type of employment support*
Volunteers
Proportion of people who reported doing volunteer work
Wants a Paid Job in the Community
Proportion of people who were reported not to have a job in the community and who reported they would like a job in the community
Worked 10 out of last 12 months
Proportion of people who were reported to have a job in community employment who worked 10 of the past 12 months in community employment
Access
Publicly-funded services are readily available to individuals who need and qualify for them.
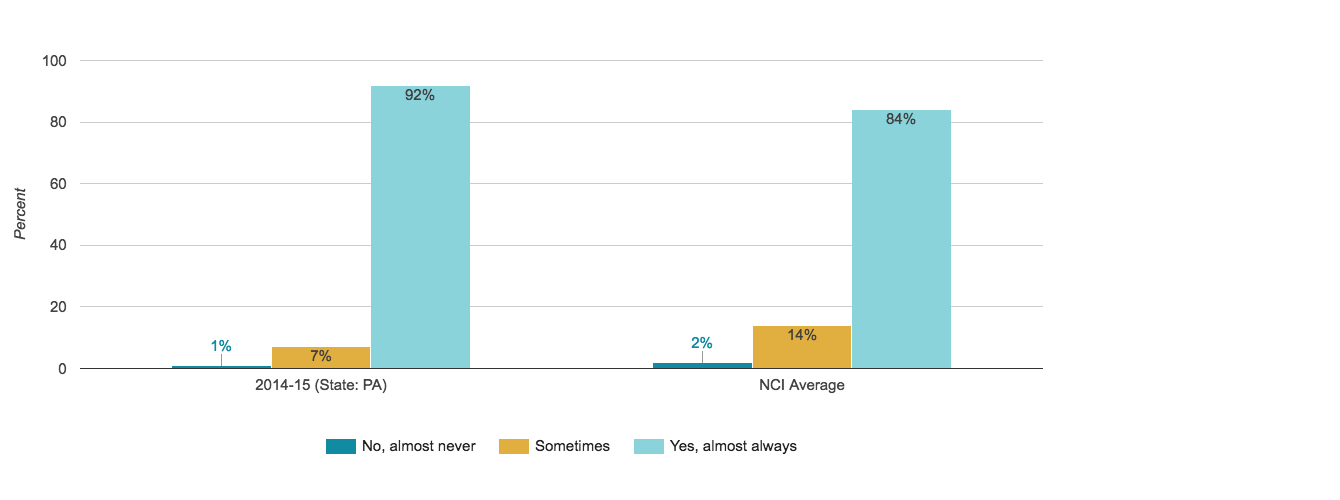
Always Has a Way to Get Places
Proportion of people who reported they always they have a way to get places when they want to go somewhere
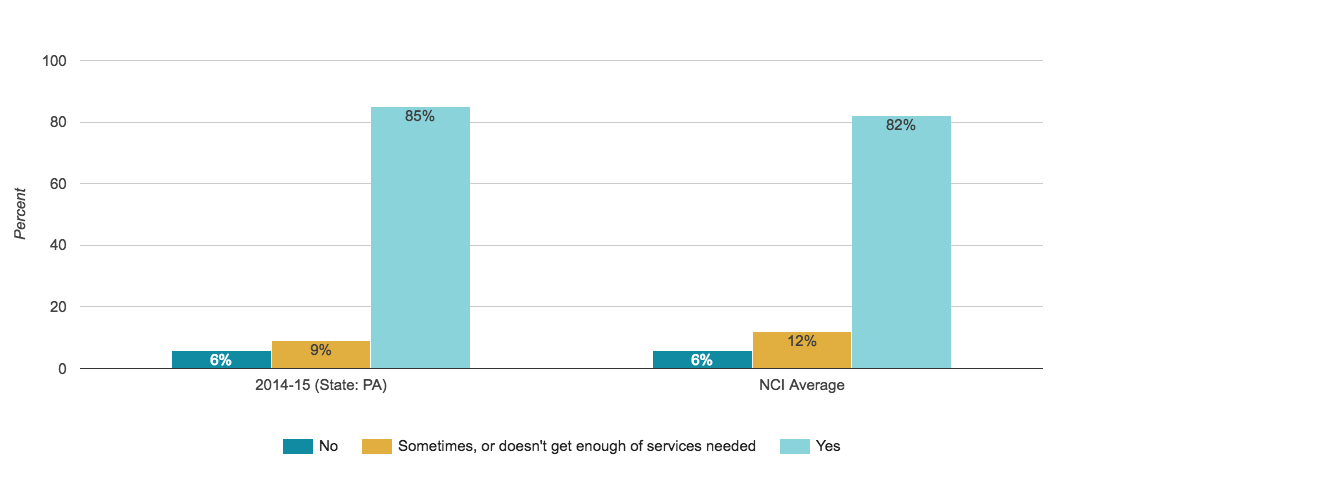
Gets Needed Services
Proportion of people who report getting the services they need
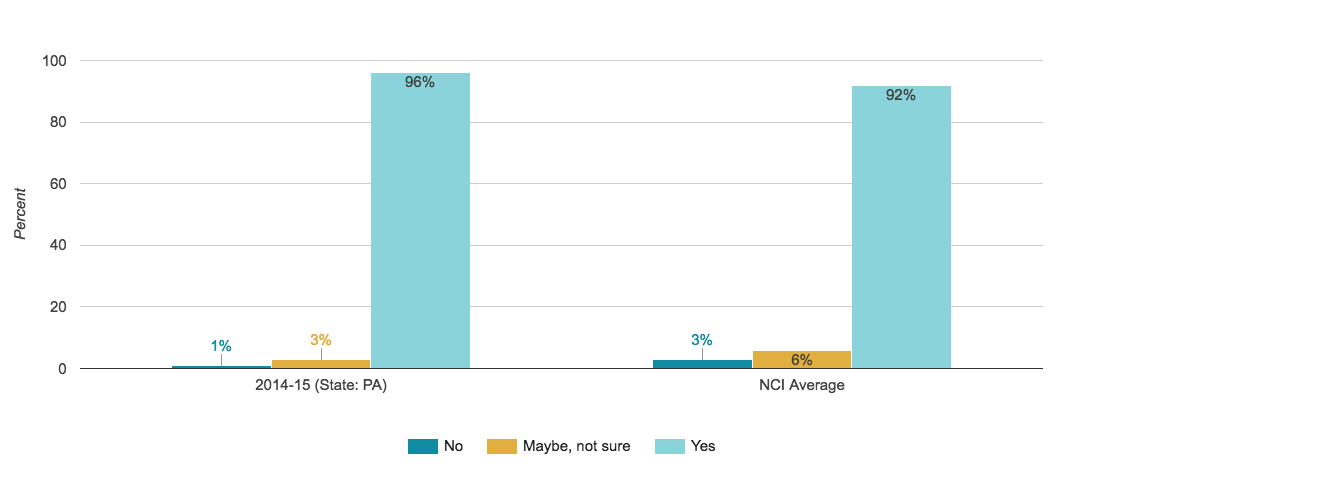
Staff Have Right Training to Meet Person's Needs
Proportion of people who reported their staff have adequate training to meet their needs
Service Coordination
Service coordinators are accessible, responsive, and support the person’s participation in service planning.
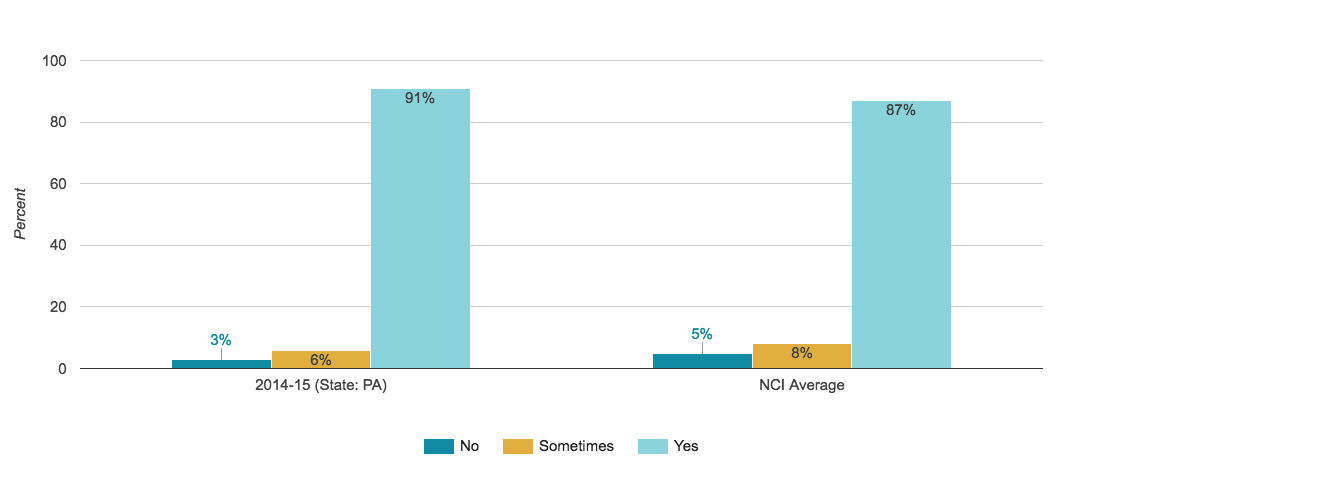
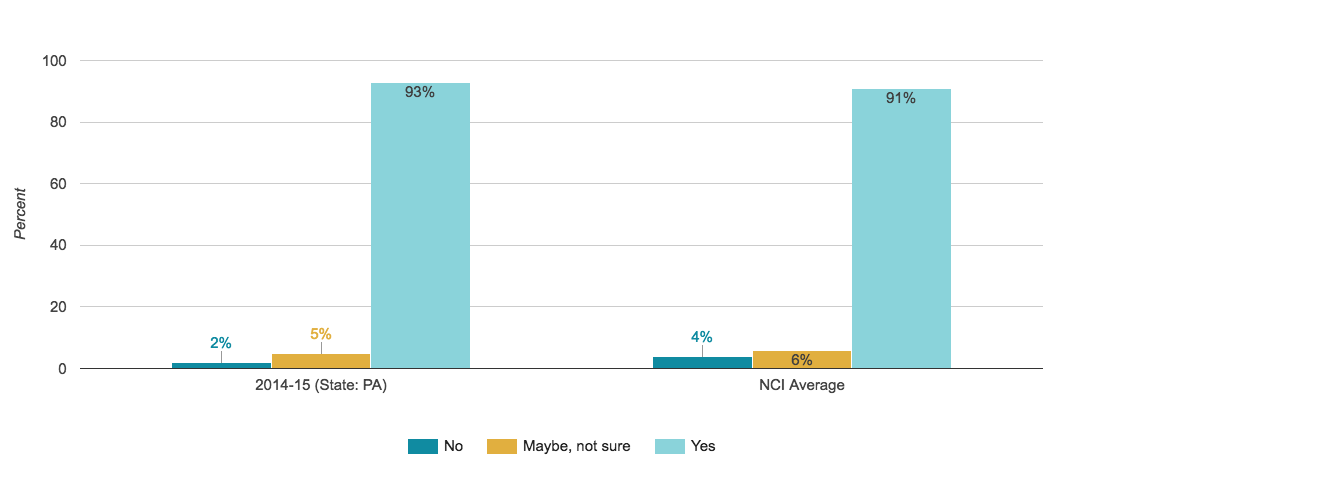
Case Manager/Service Coordinator Asks What the Person Wants
Proportion of people who reported their service coordinator/case manager asks them what they want
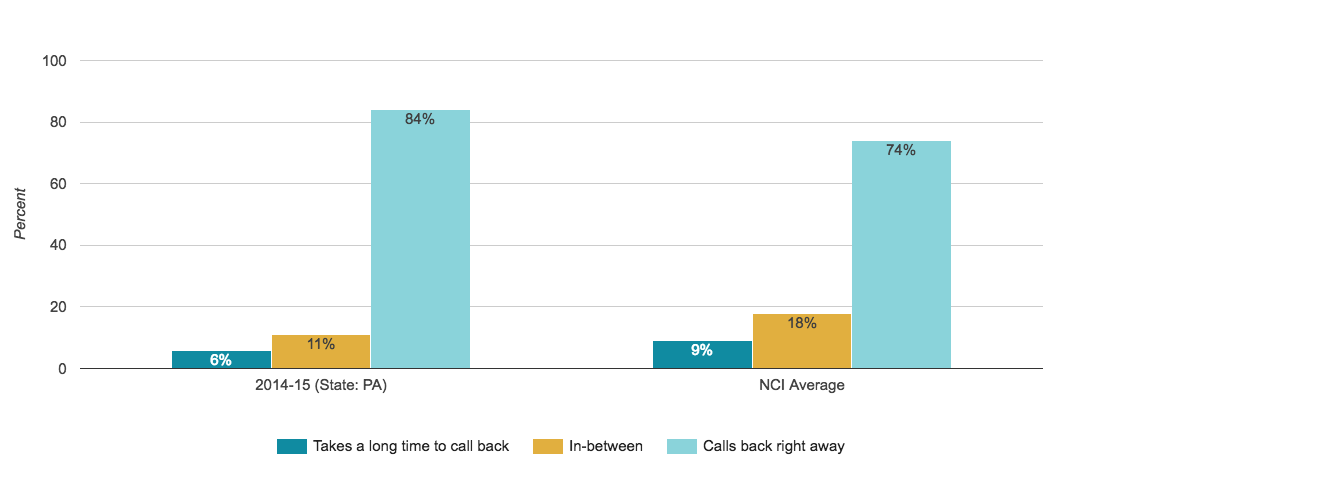
Case Manager/Service Coordinator Calls Person Back Right Away
Proportion of people who reported their service coordinator/case manager calls them back right away
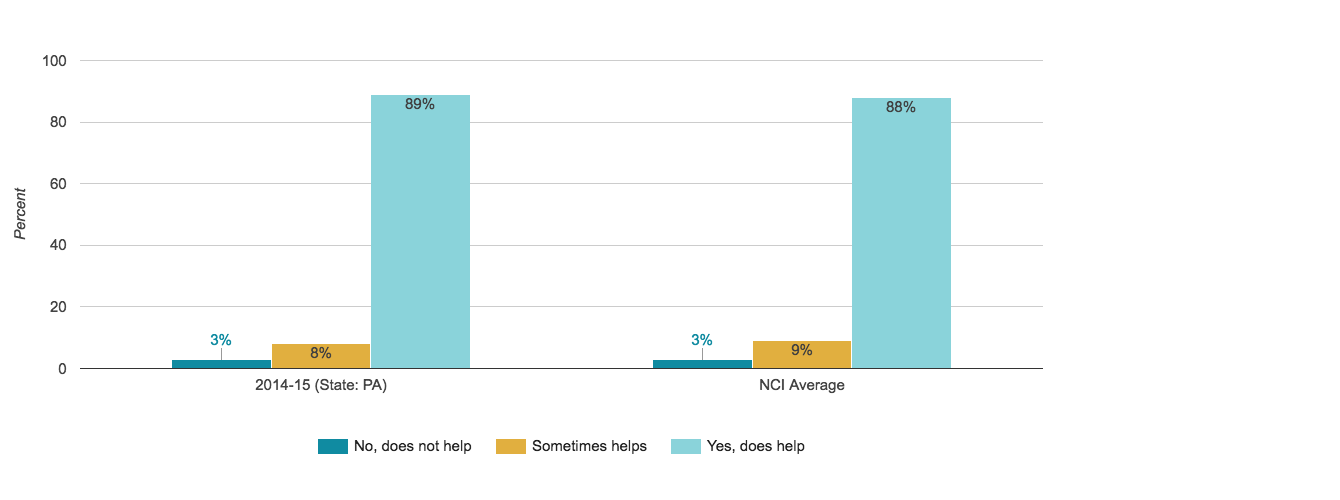
Case Manager/Service Coordinator Helps Get What Person Needs
Proportion of people who reported their service coordinator/case manager helps them get what they need
Has Help Needed to Fix Problems with Staff
Proportion of people who reported who get the help they need to work out problems they have with their support workers
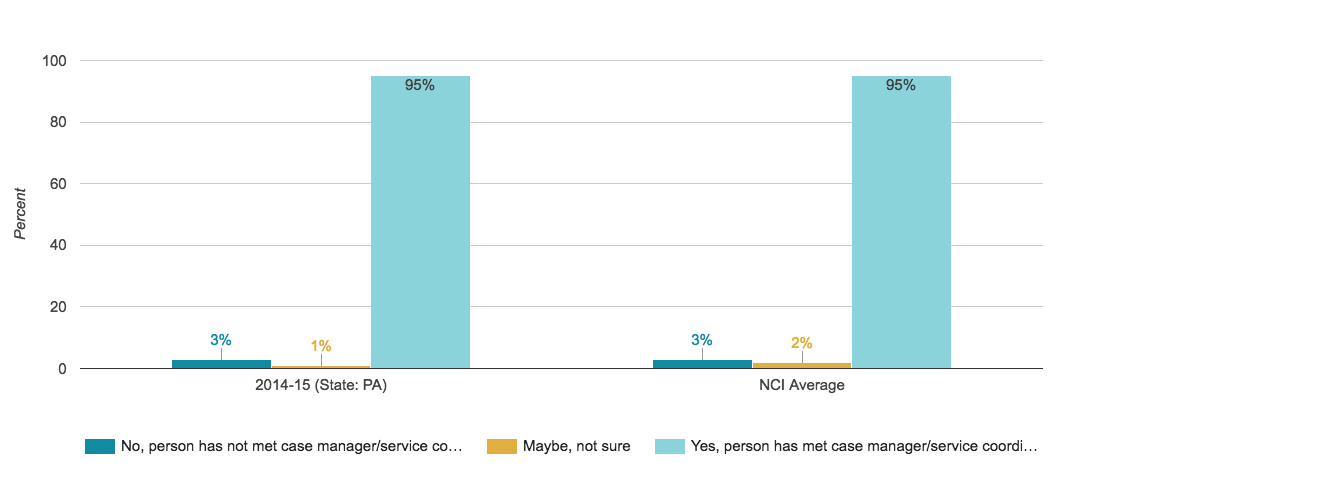
Met Case Manager/Service Coordinator
Proportion of people who reported they met their service coordinator/case manager
Person Helped Make Service Plan
Proportion of people who reported they helped make their service plan