Pennsylvania
State Report: 2017-18
View State WebsiteThe NCI Adult Consumer Survey is an interview conducted with a person who is receiving services from the state; it is used to gather data on approximately 60 consumer outcomes, and it is regularly refined and tested to ensure that it is valid and reliable. Interviewers meet with individuals to ask questions about where they live and work, the kinds of choices they make, the activities they participate in within their communities, their relationships with friends and family, and their health and well-being.
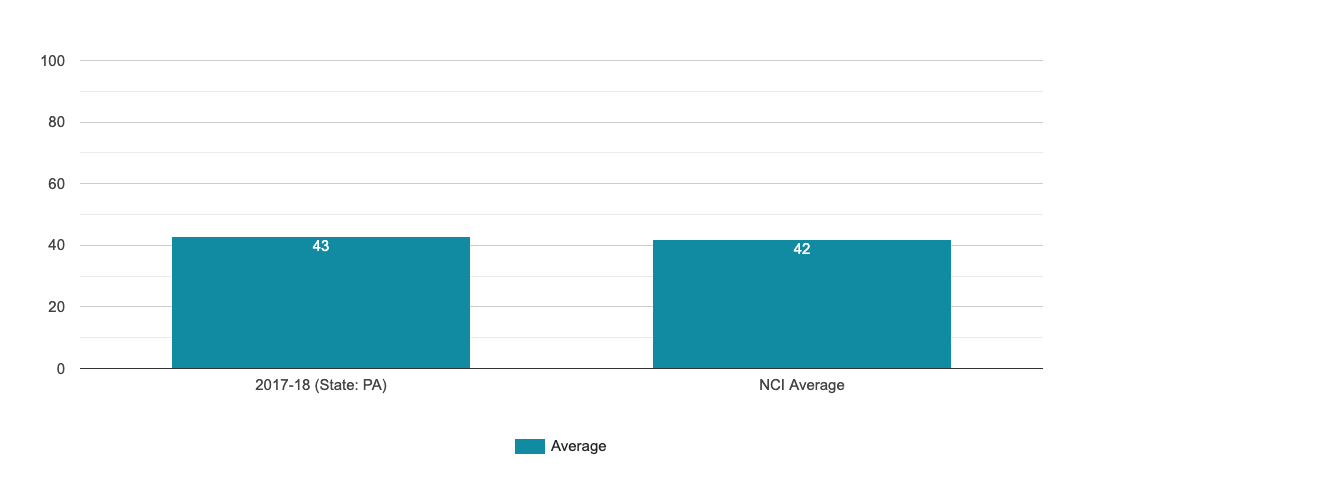
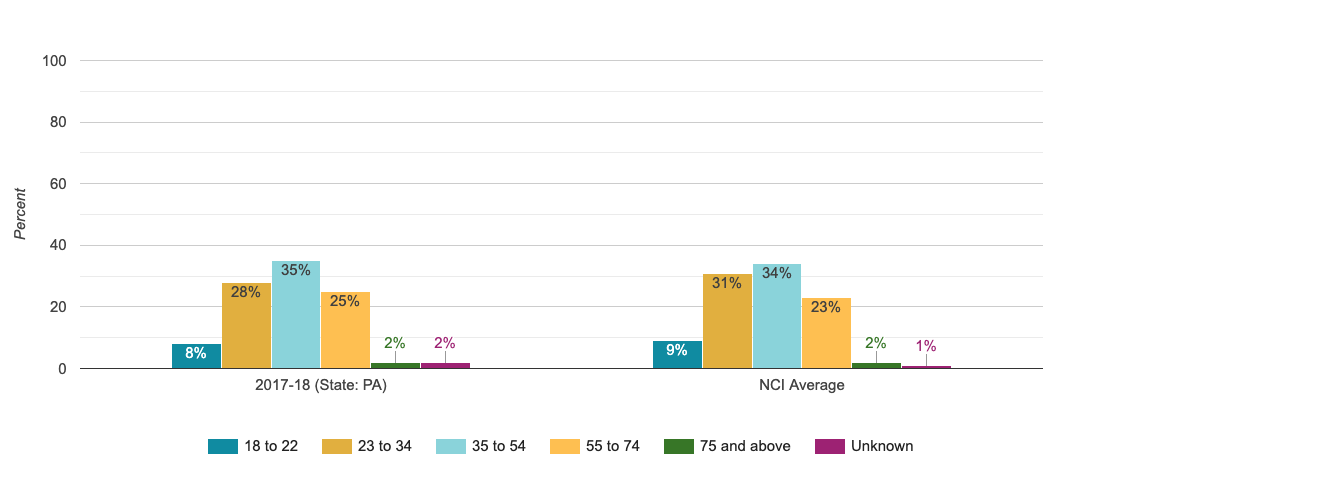
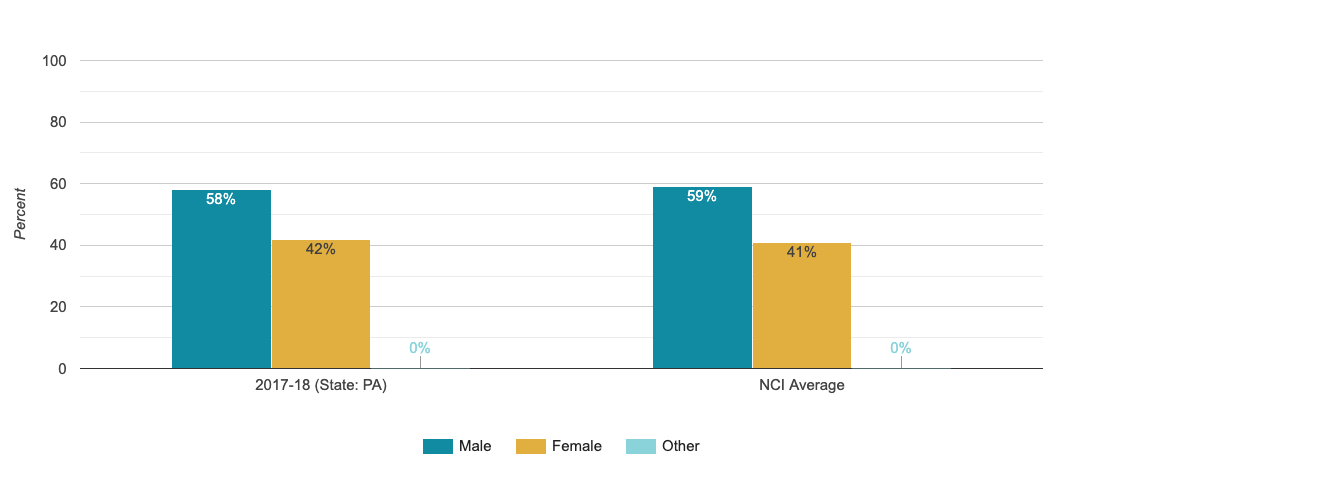
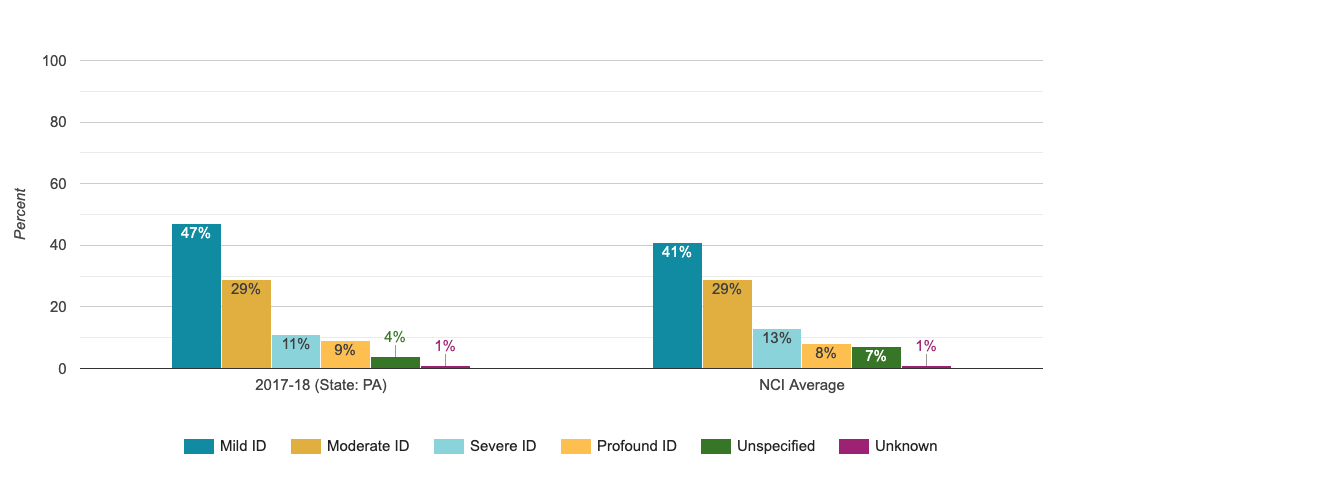
Demographics
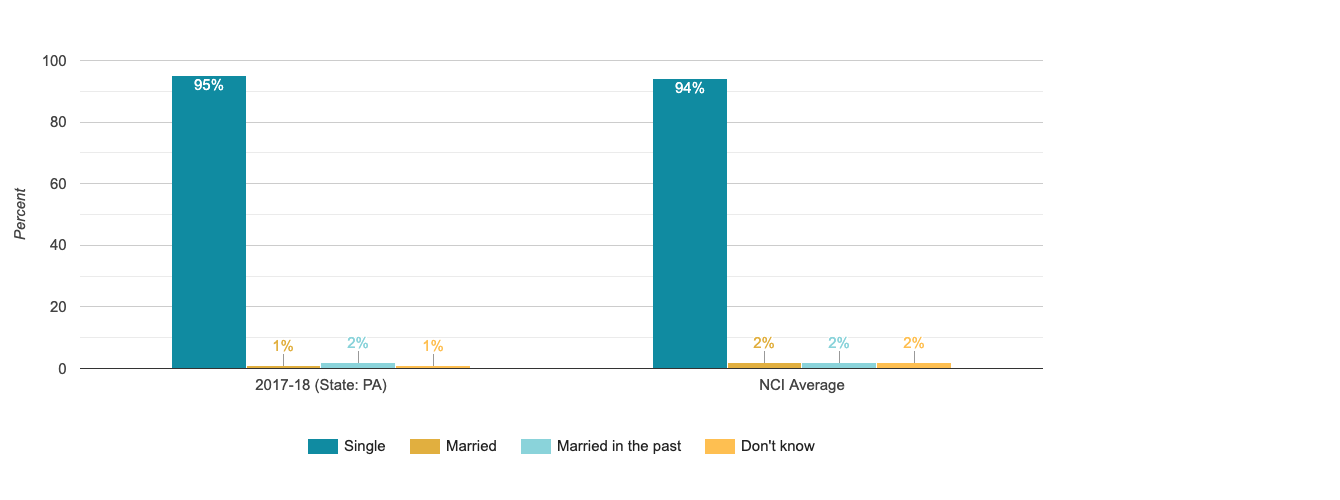
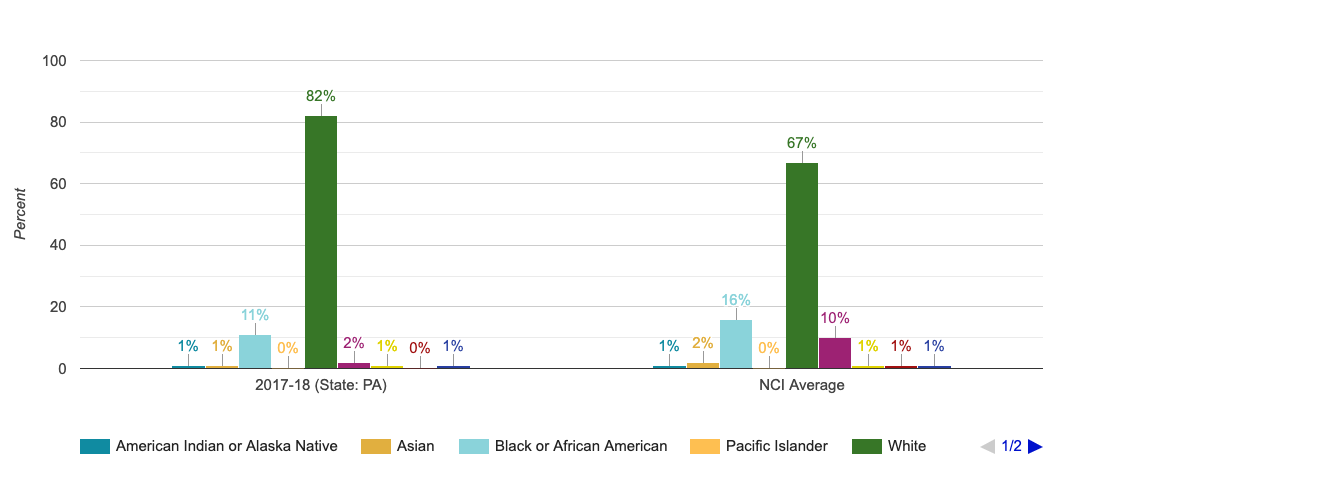
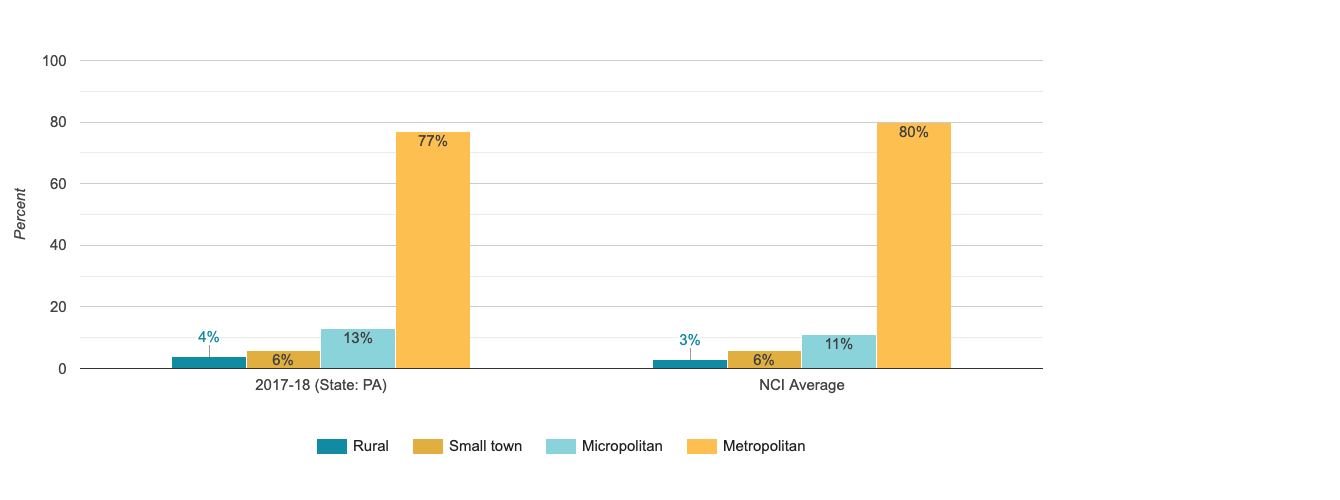
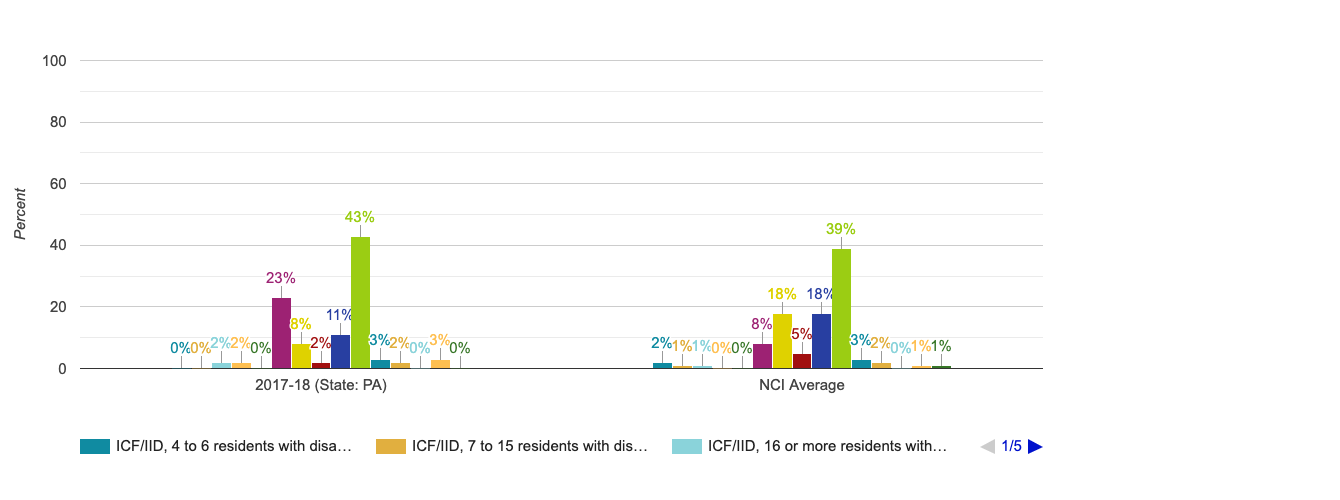
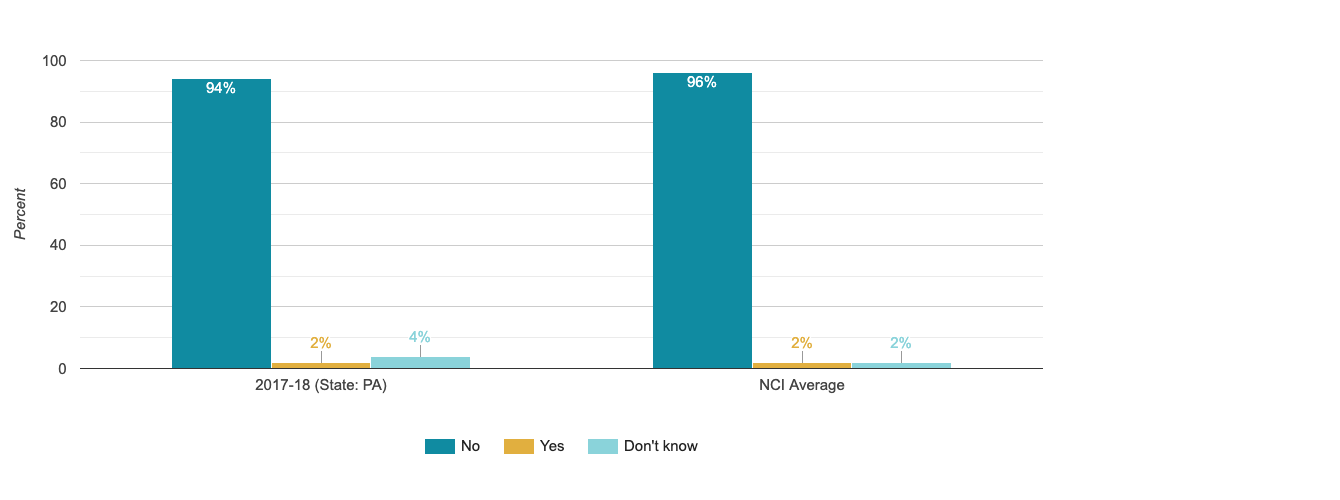

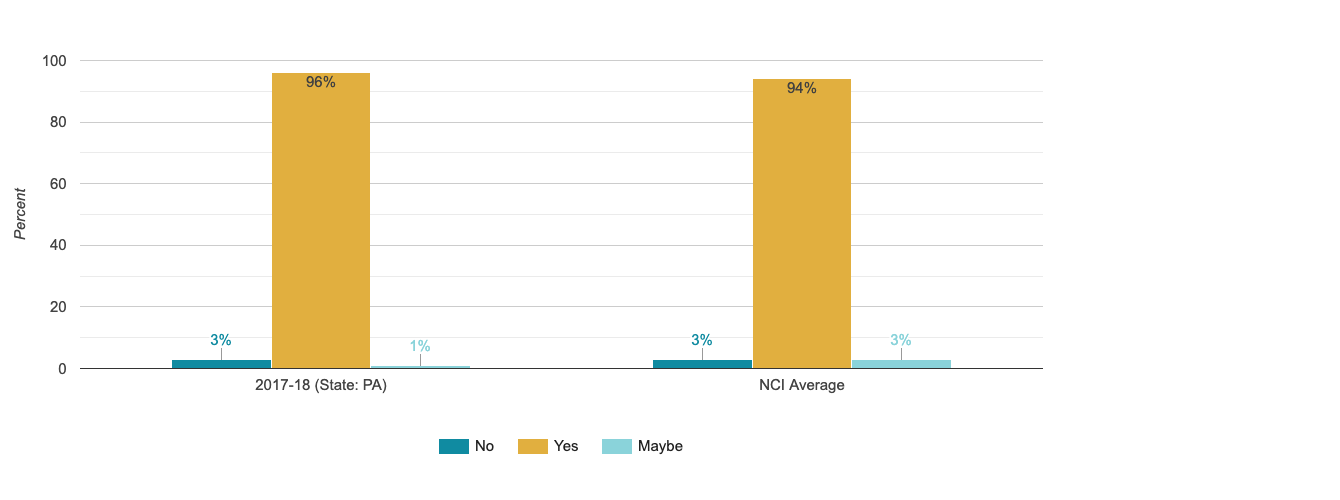
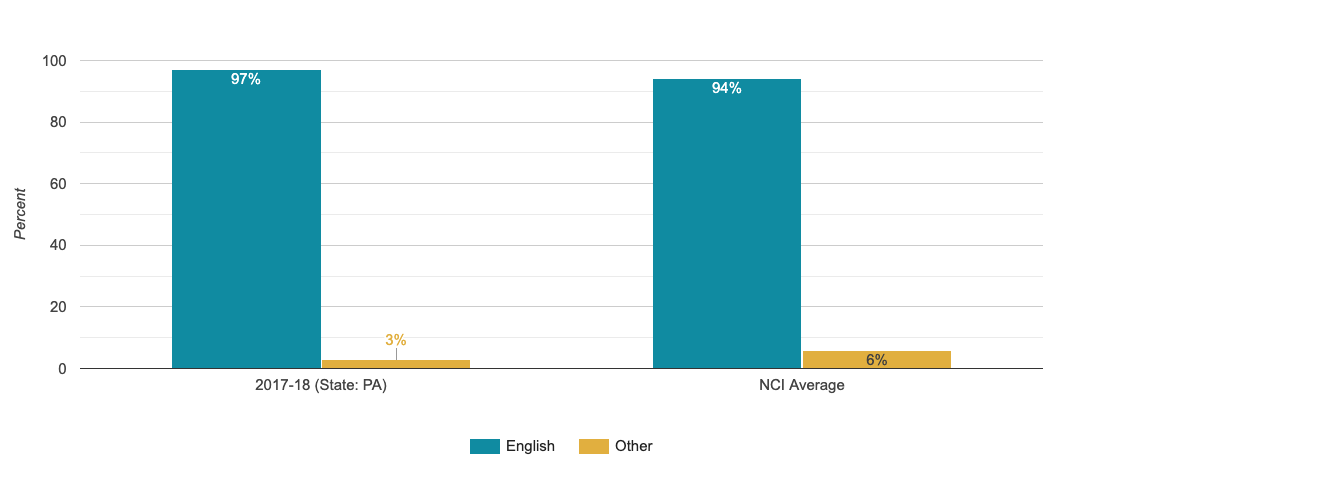
Other Diagnoses - Other Mental Illness/psychiatric Diagnosis


Choice and Decision-Making
People make choices about their lives and are actively engaged in planning their services and supports.
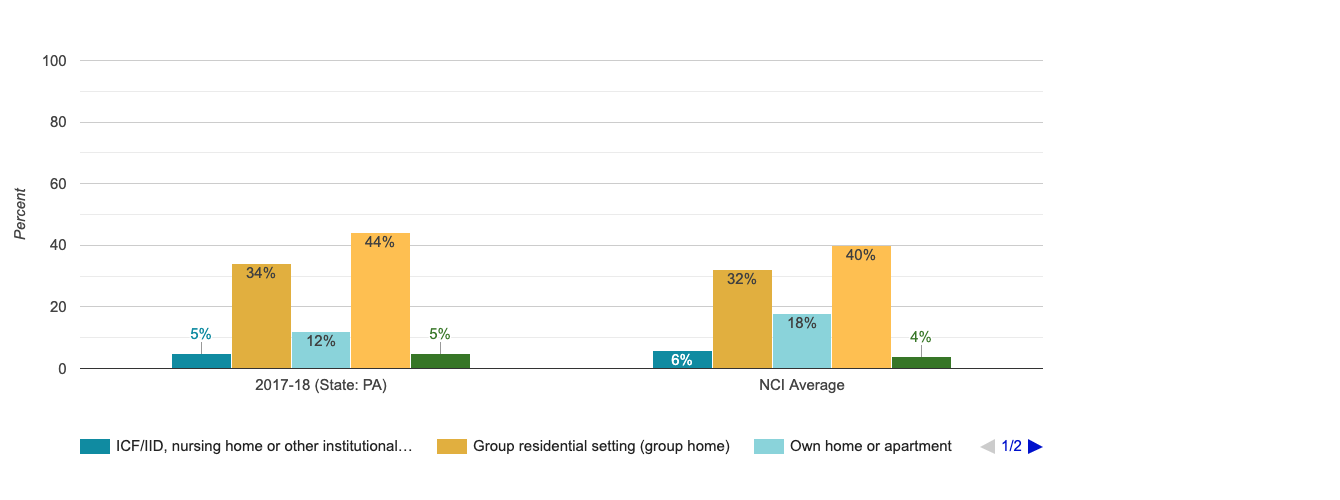
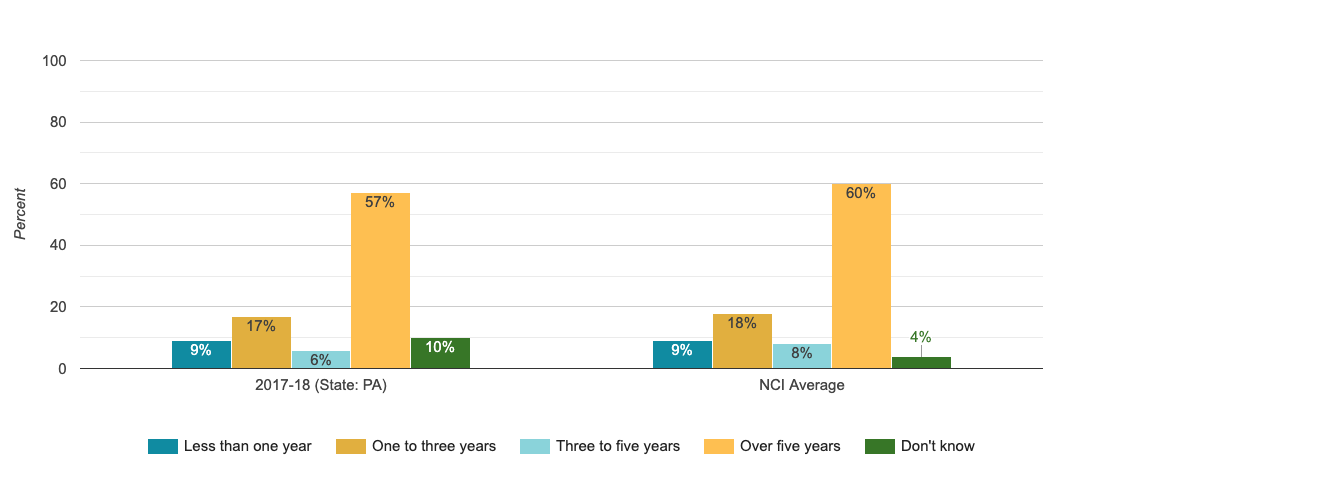
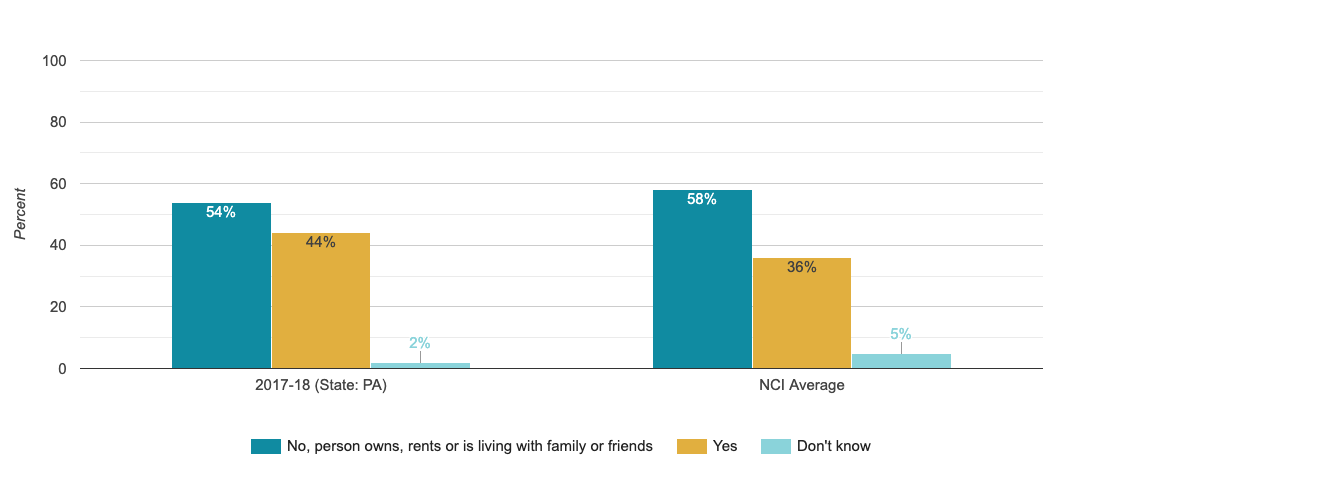
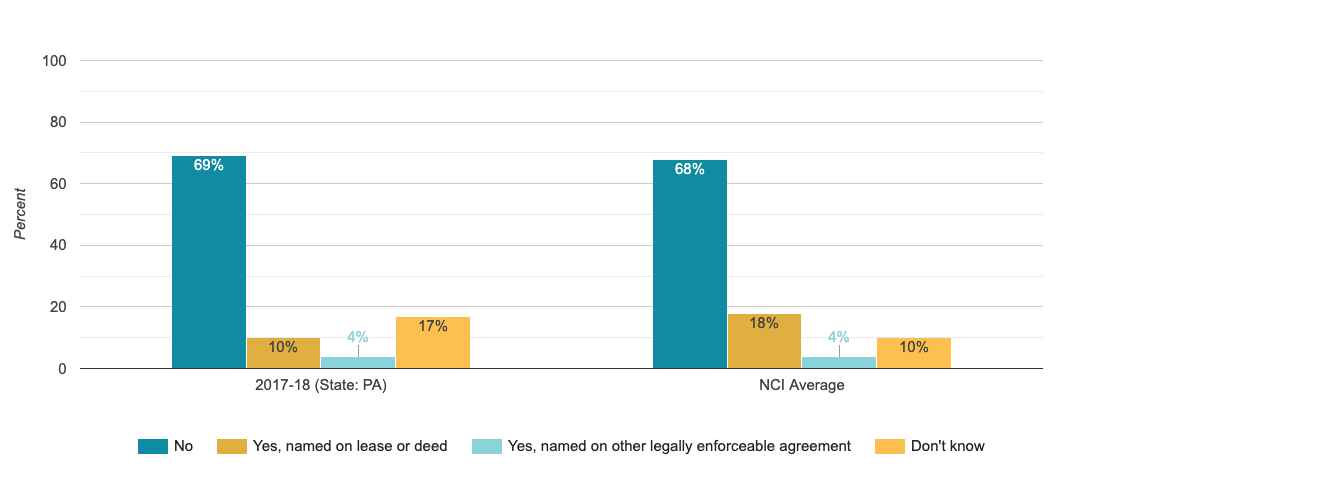
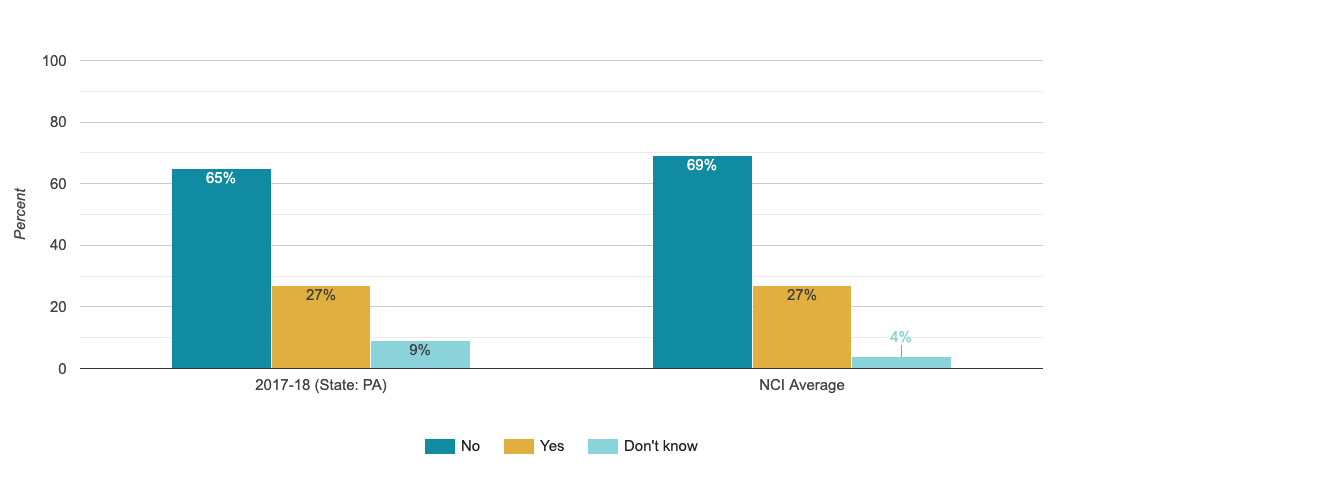
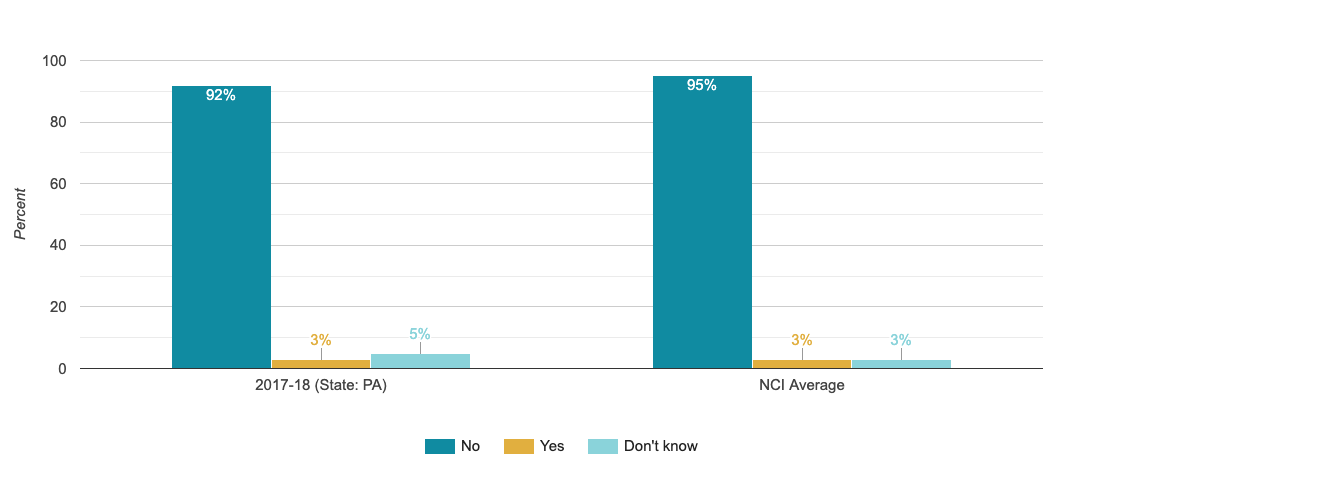
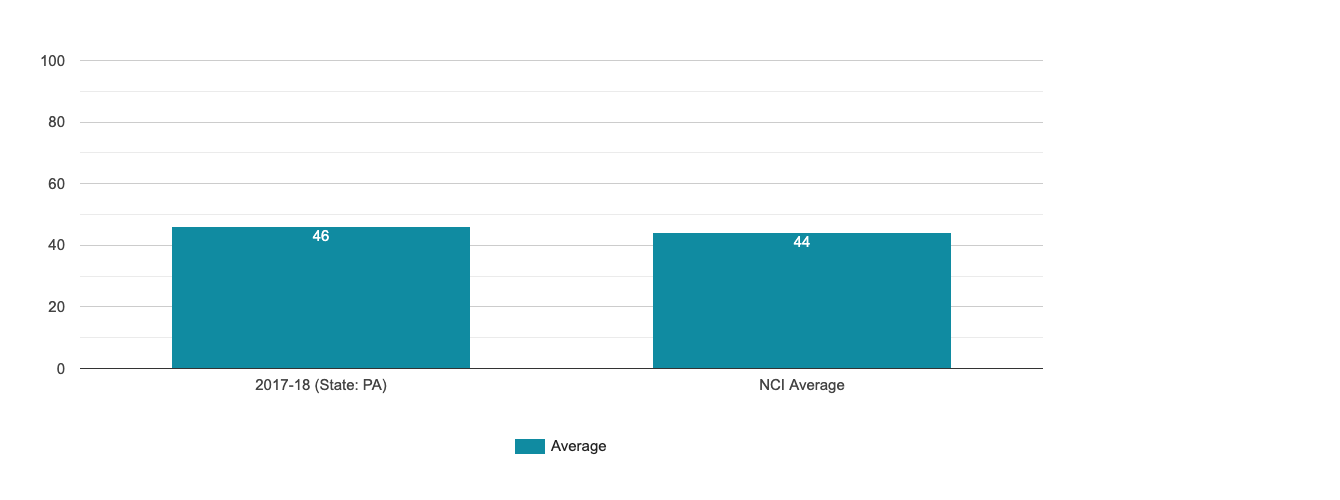
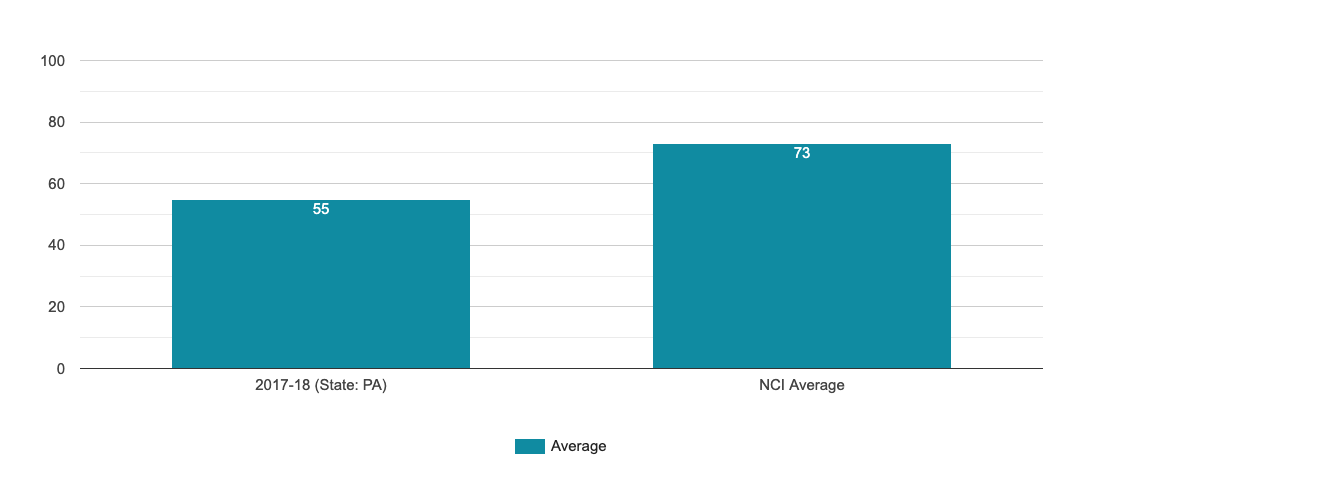
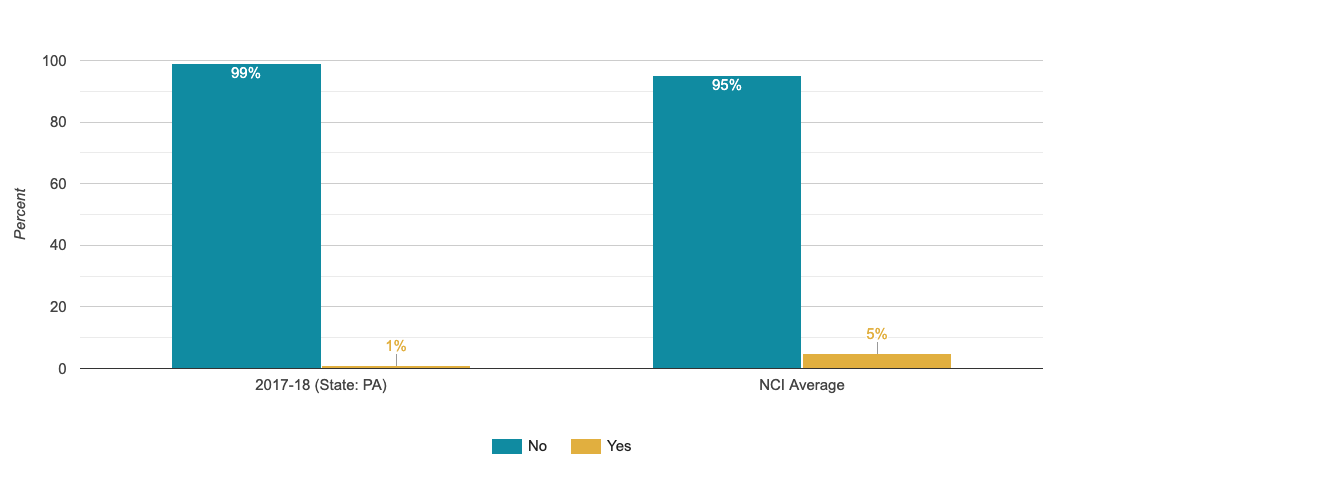
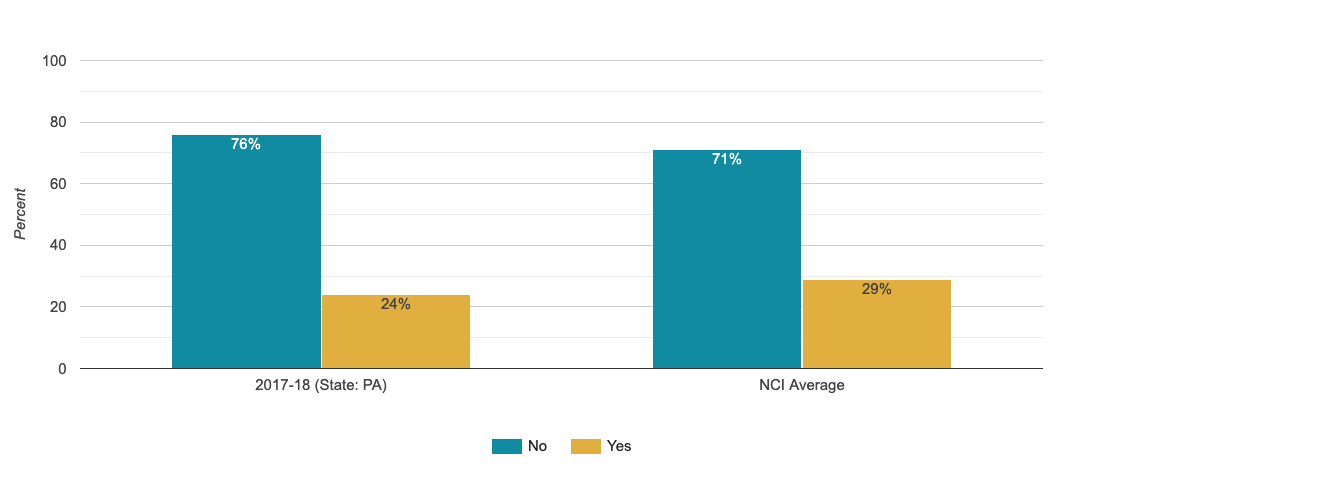
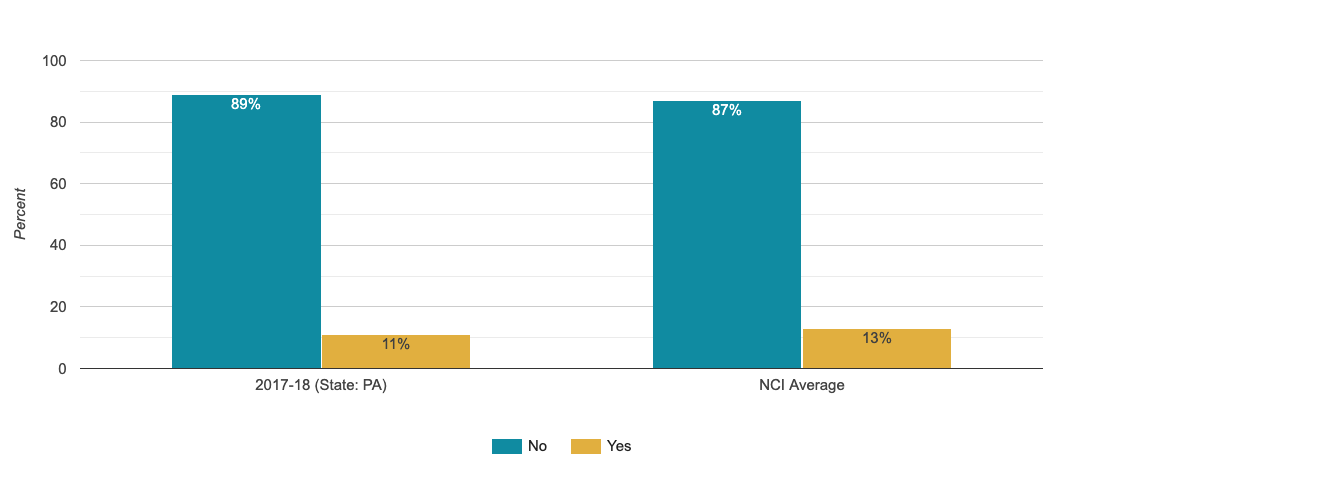
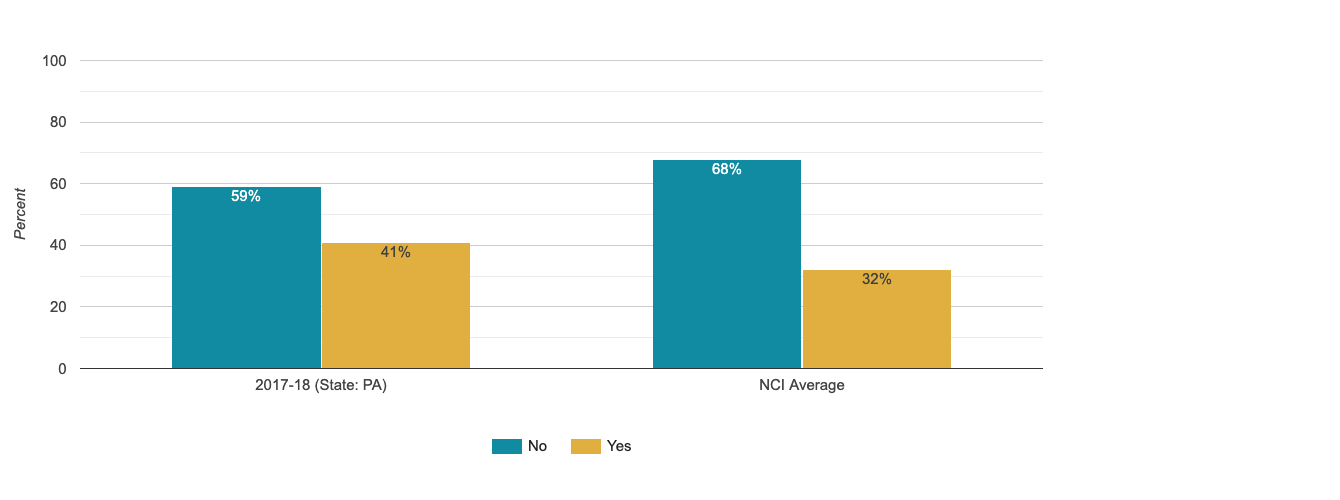
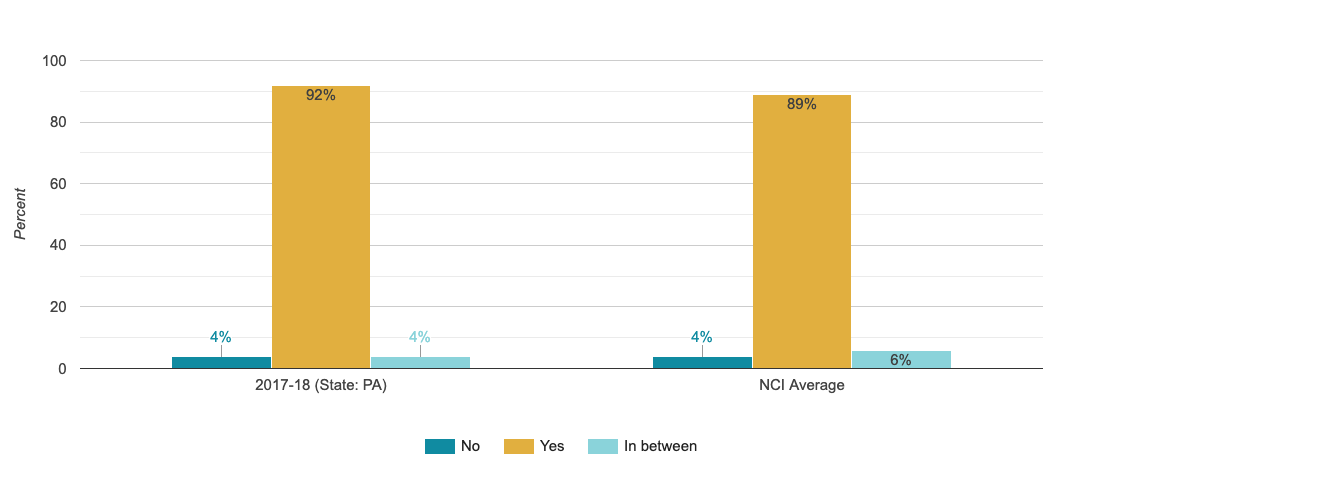
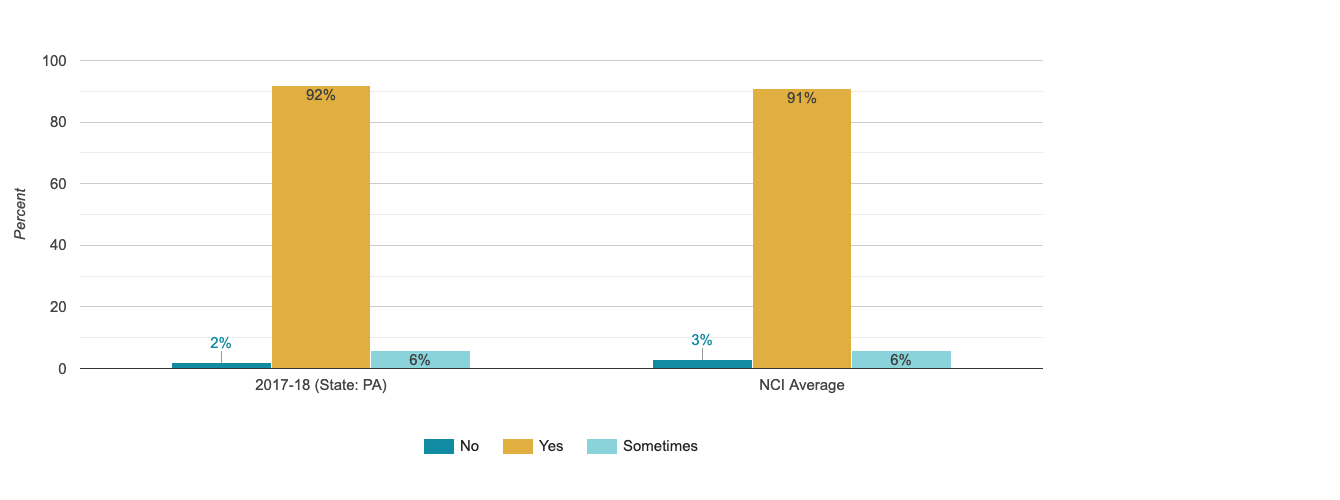
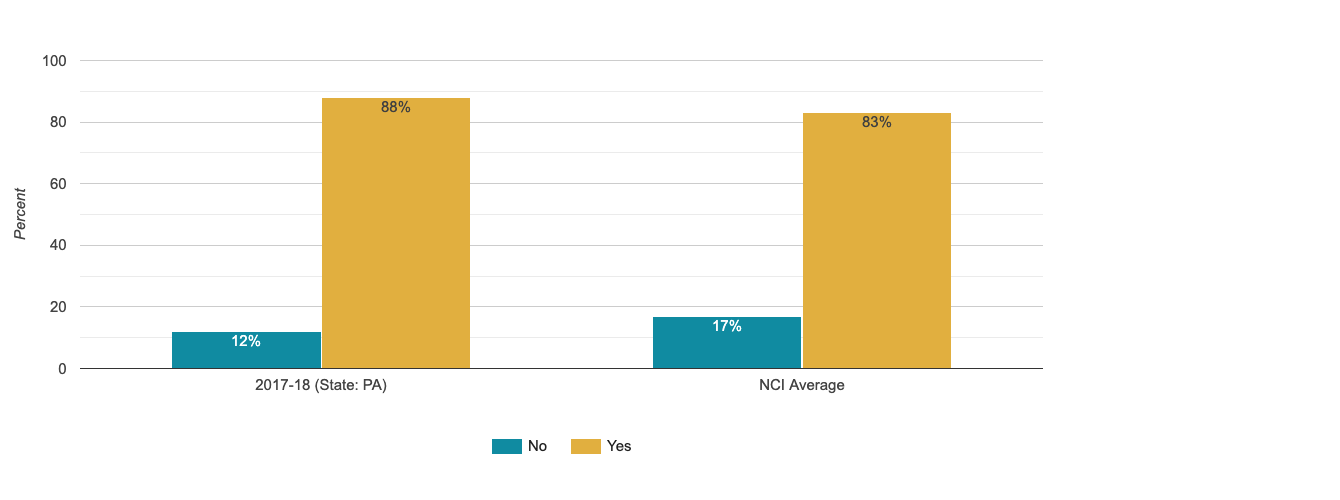
Chose Home
Of people who do not live in the family home, the percentage of people who reported having input in choosing where they live
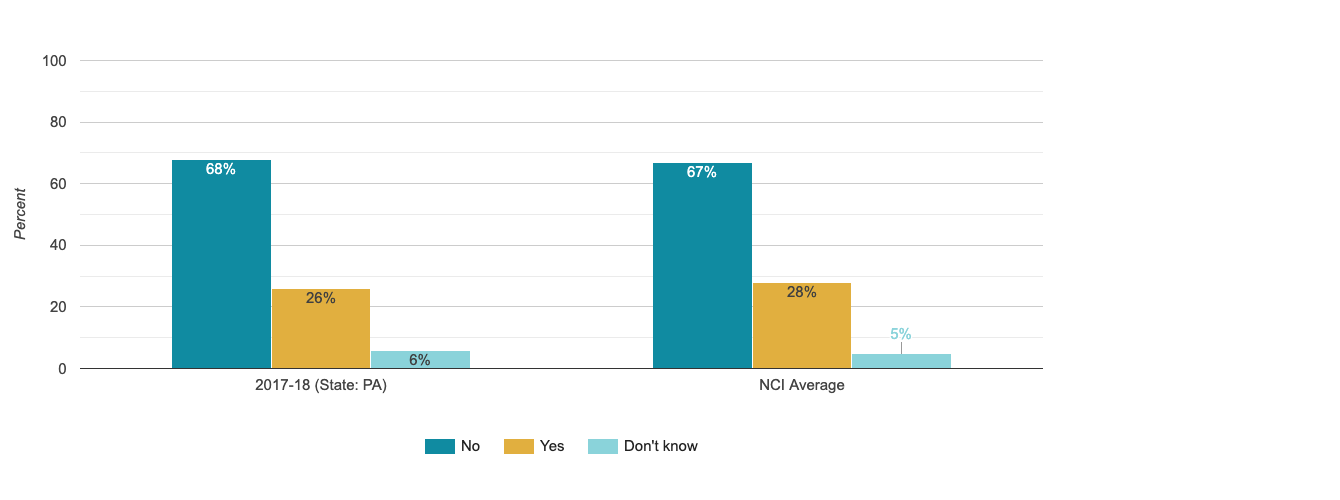
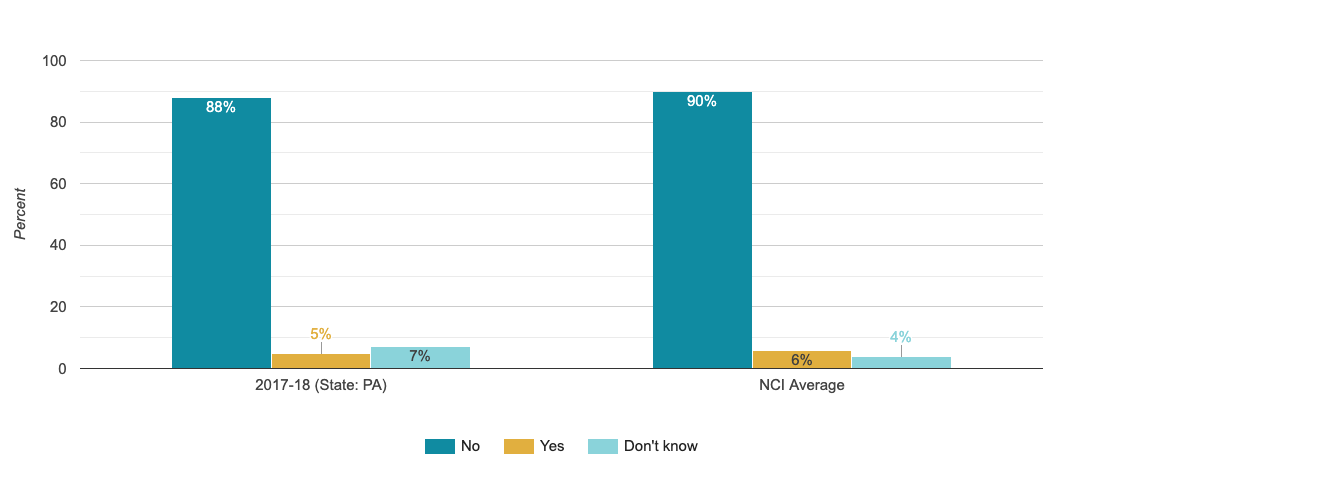
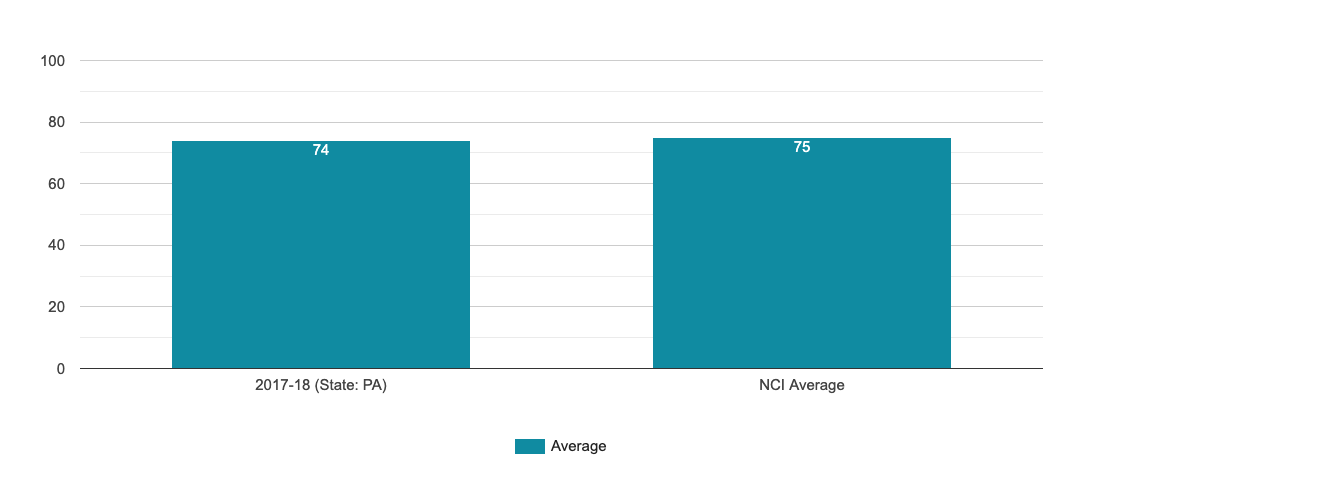
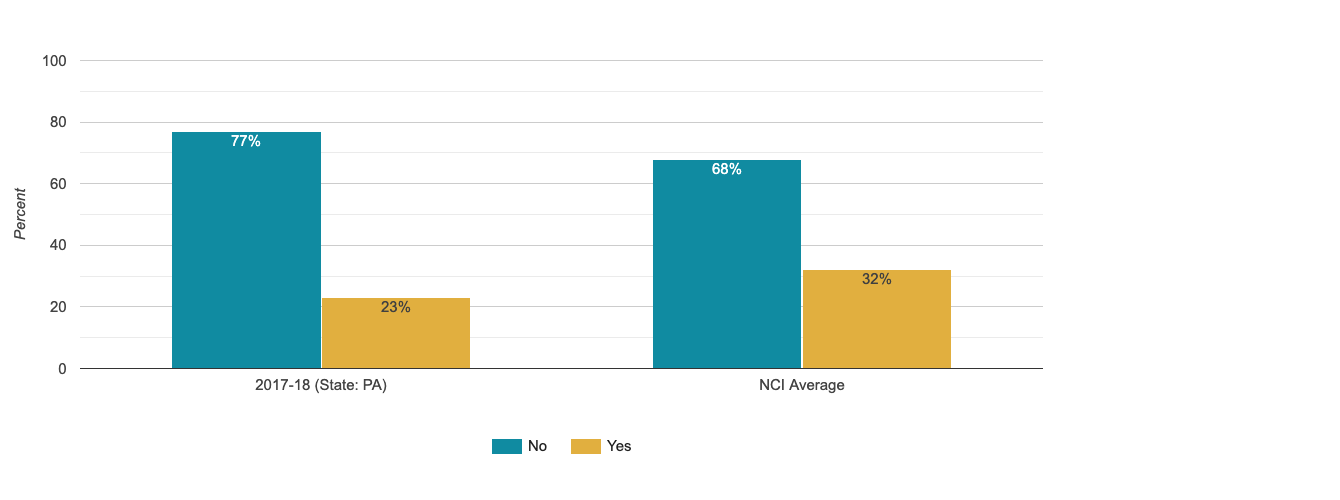
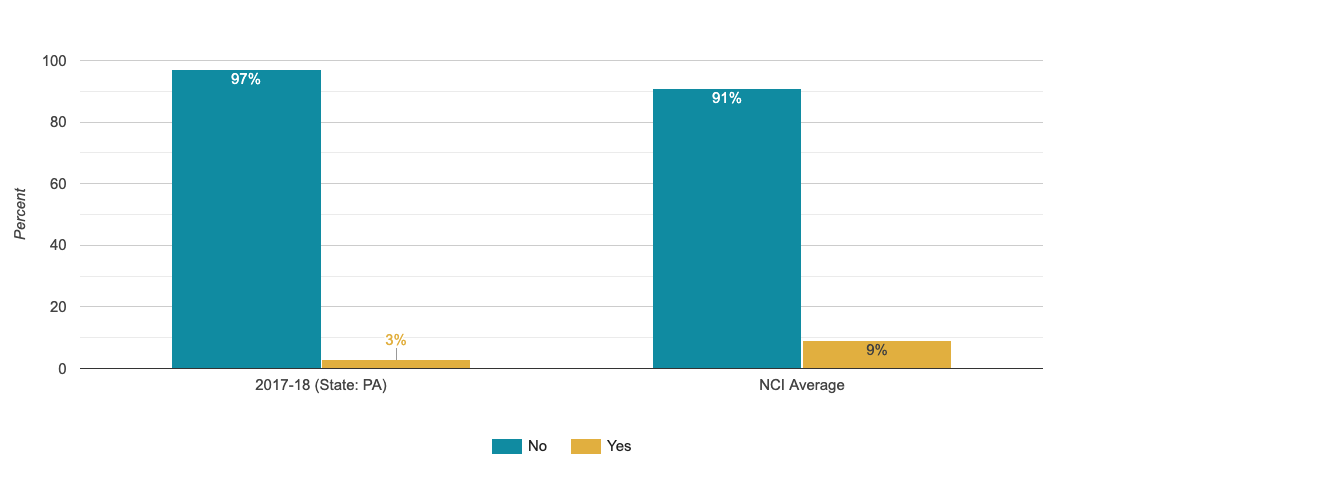
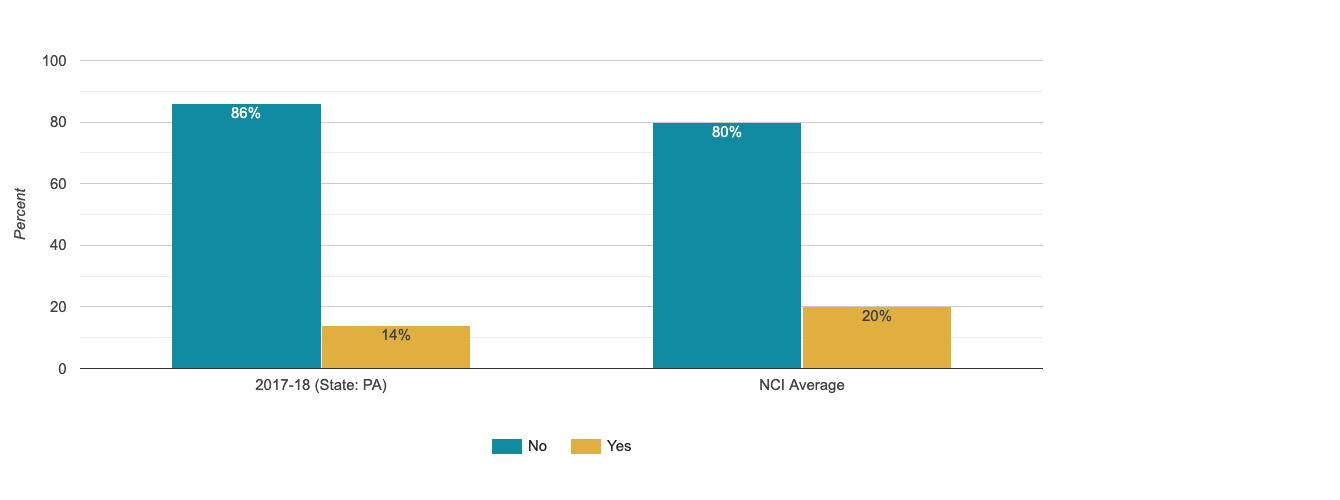
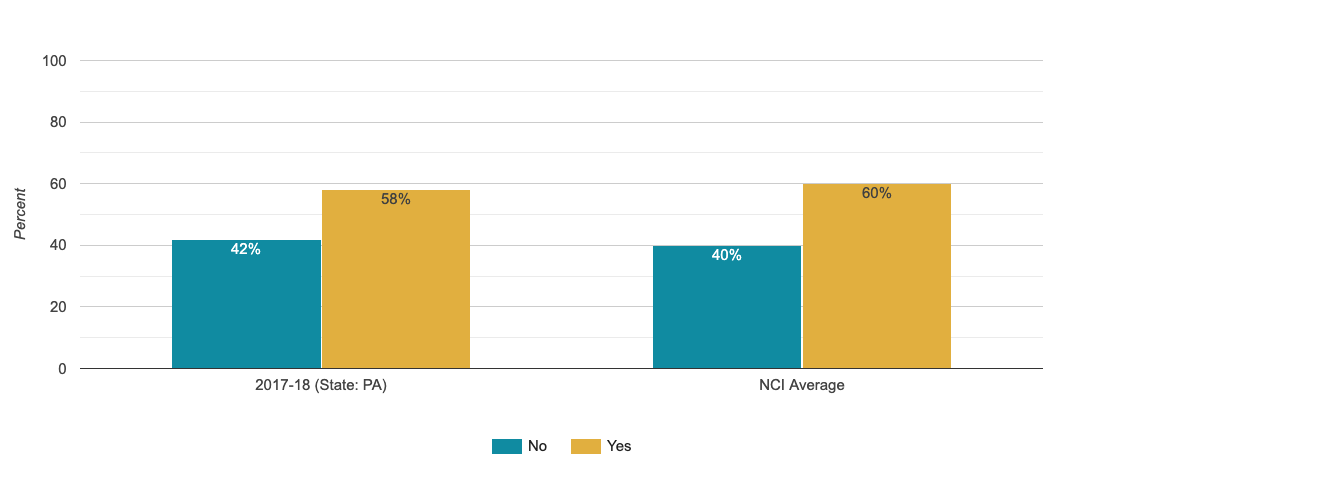
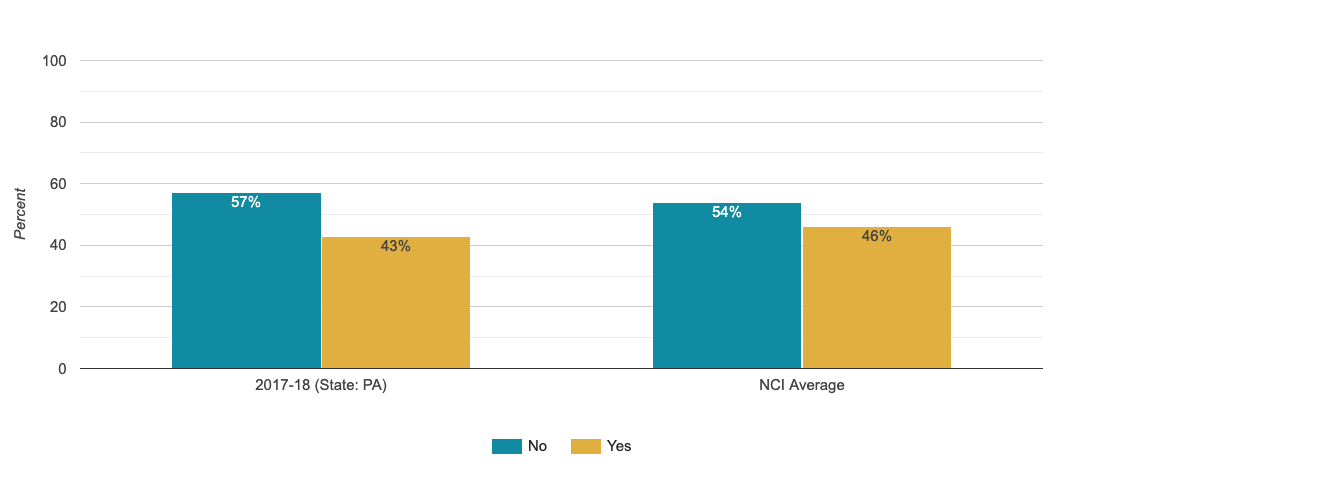
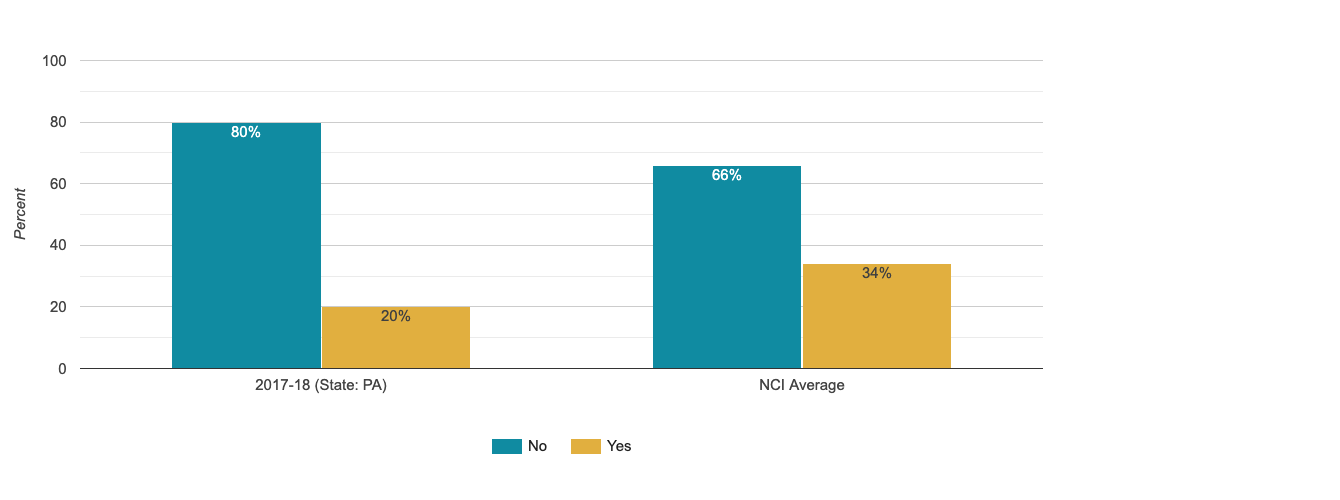
Chose Housemates
Of people who do not live in the family home, the percentage of people who reported having input in choosing housemates
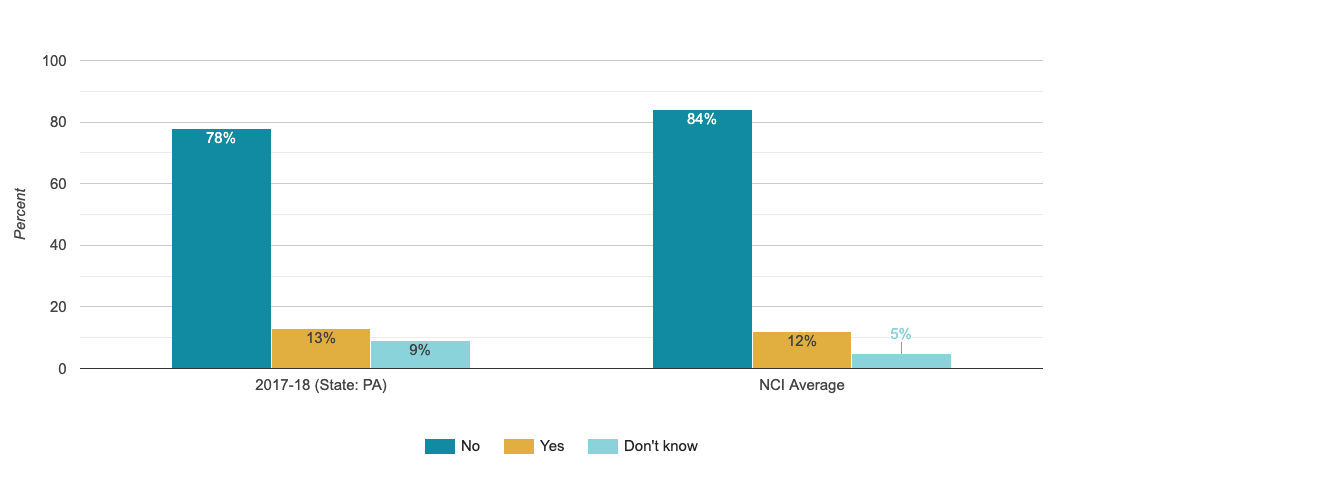
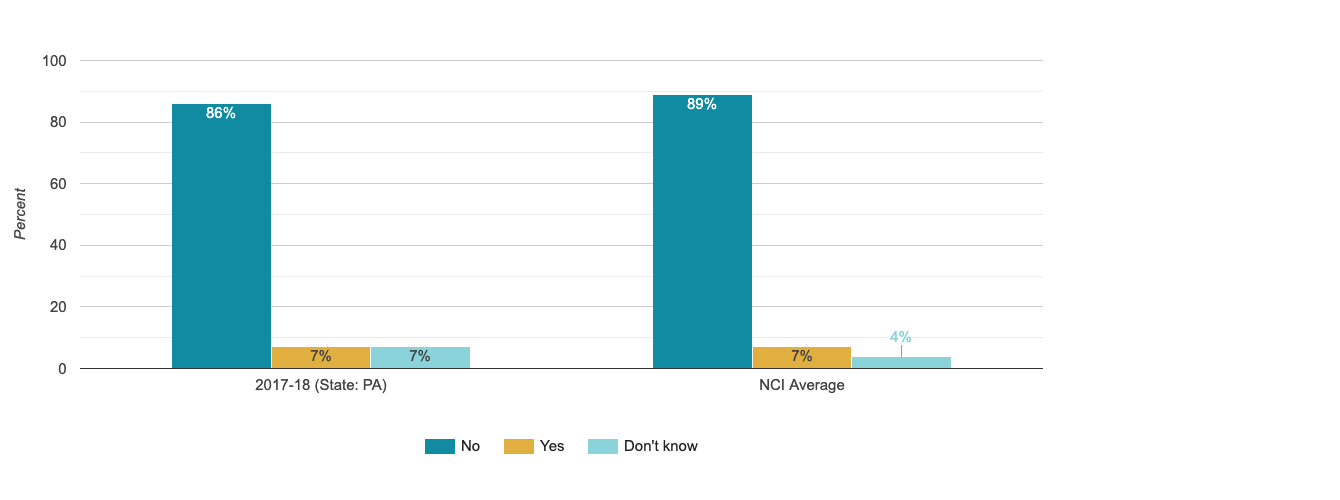
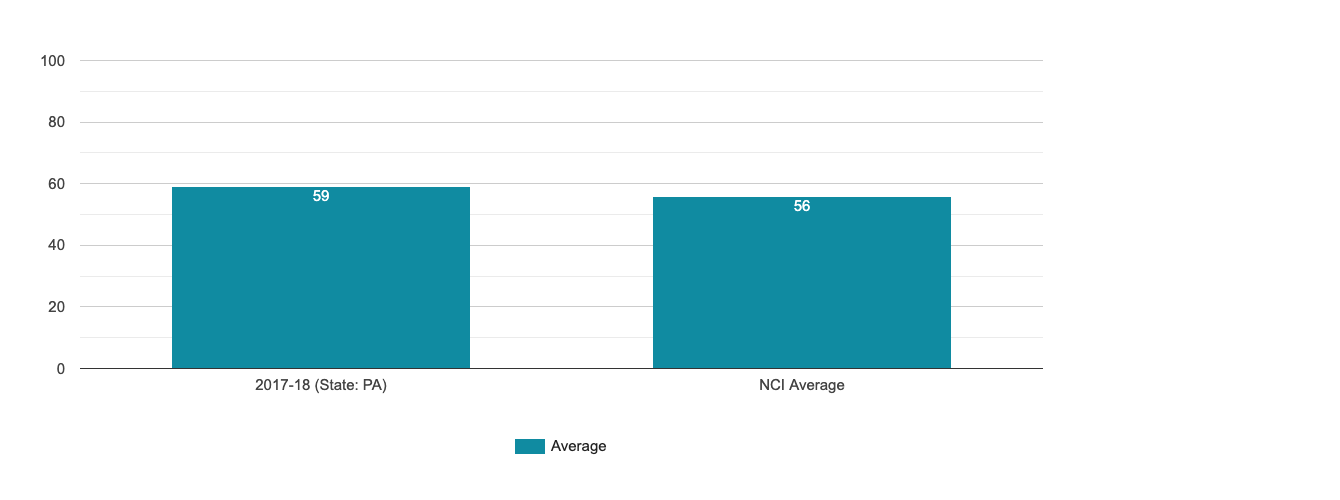
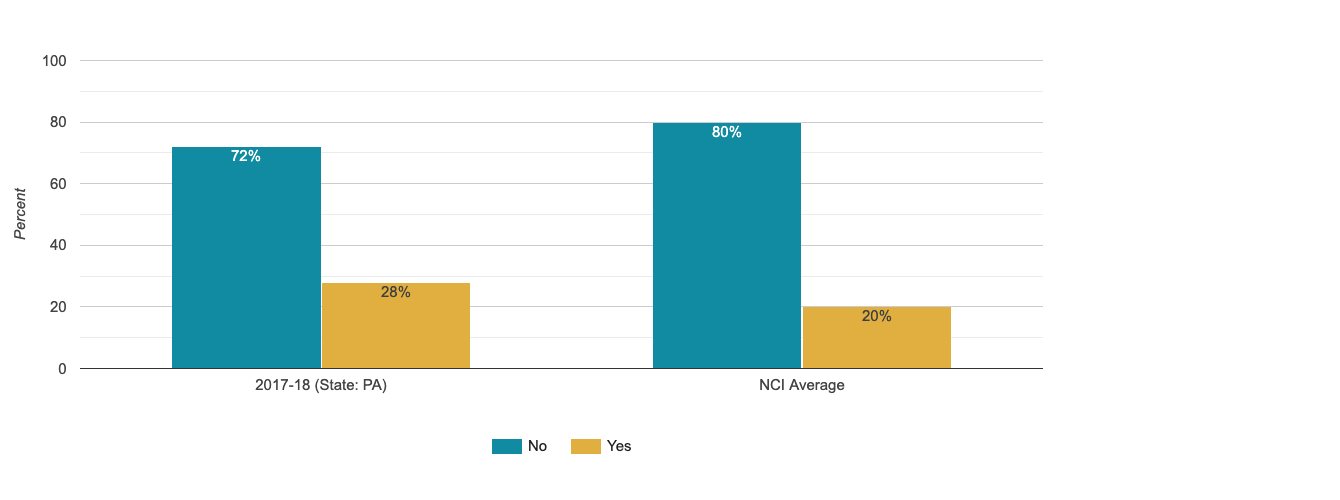
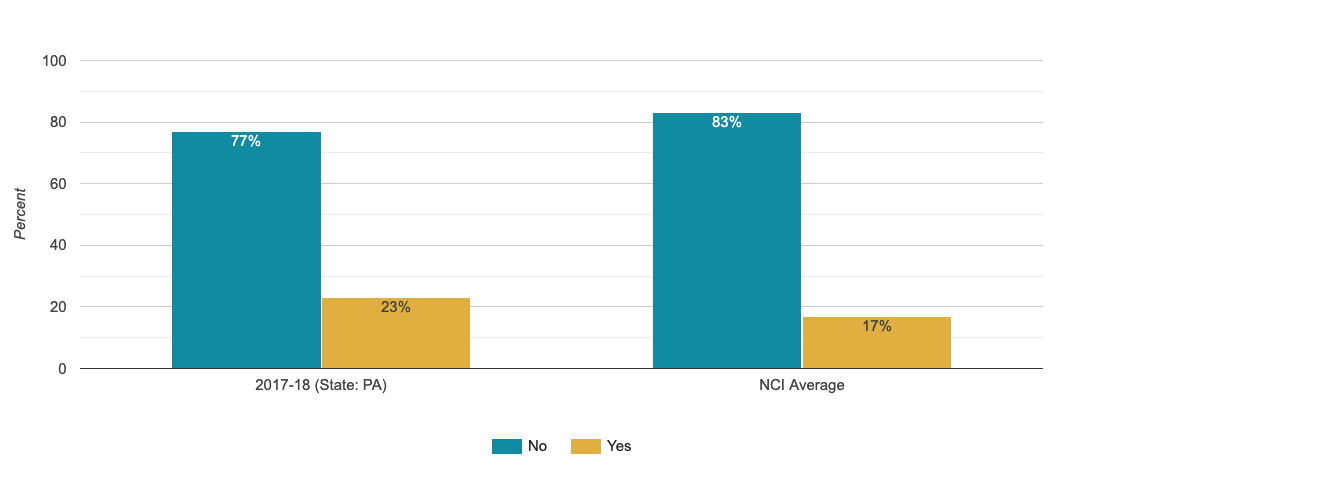
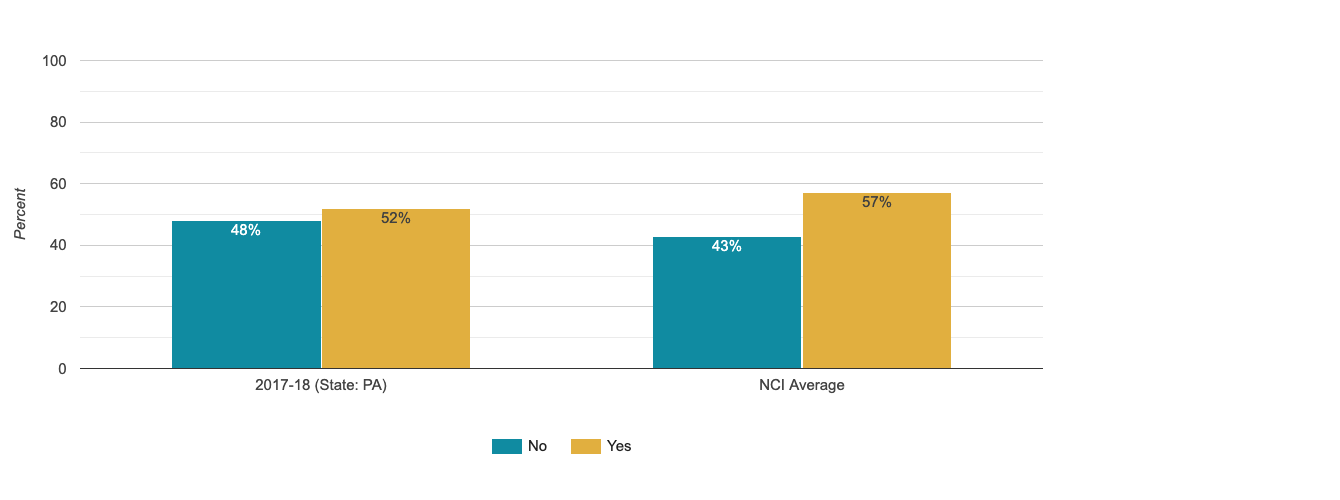
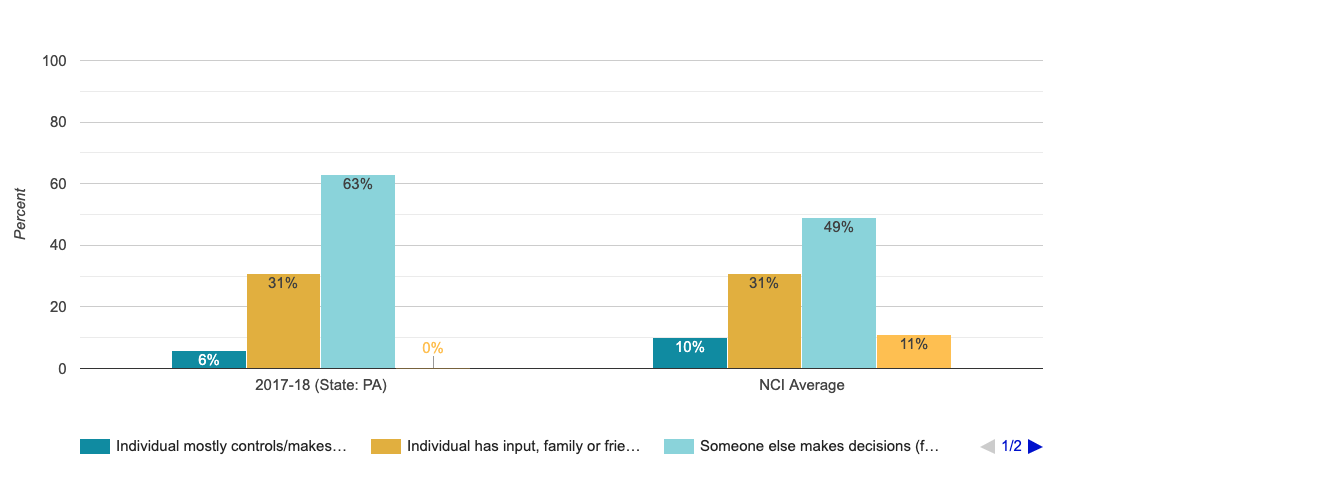
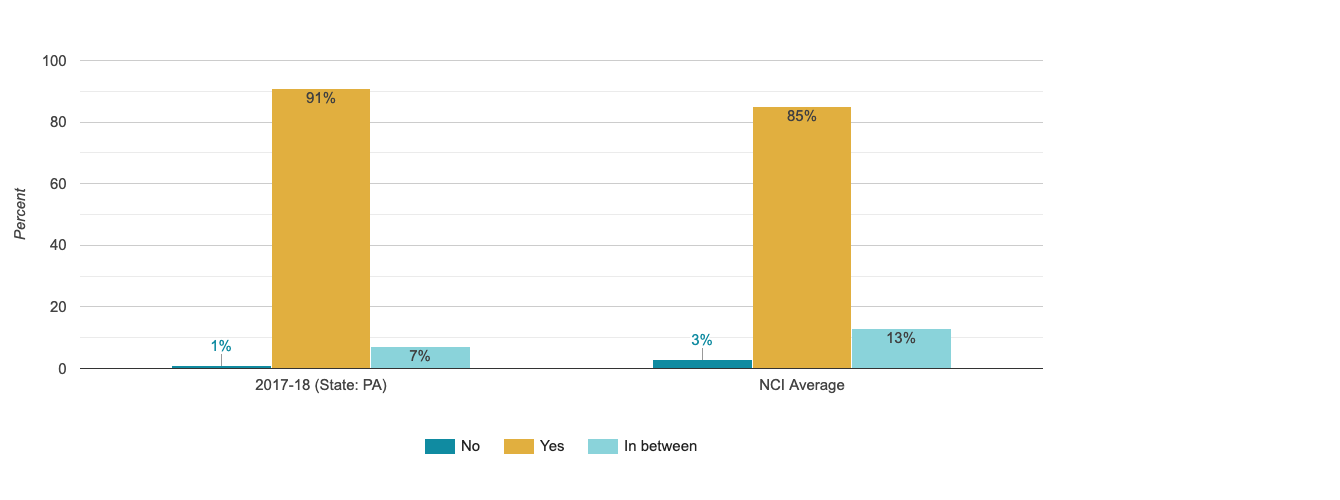
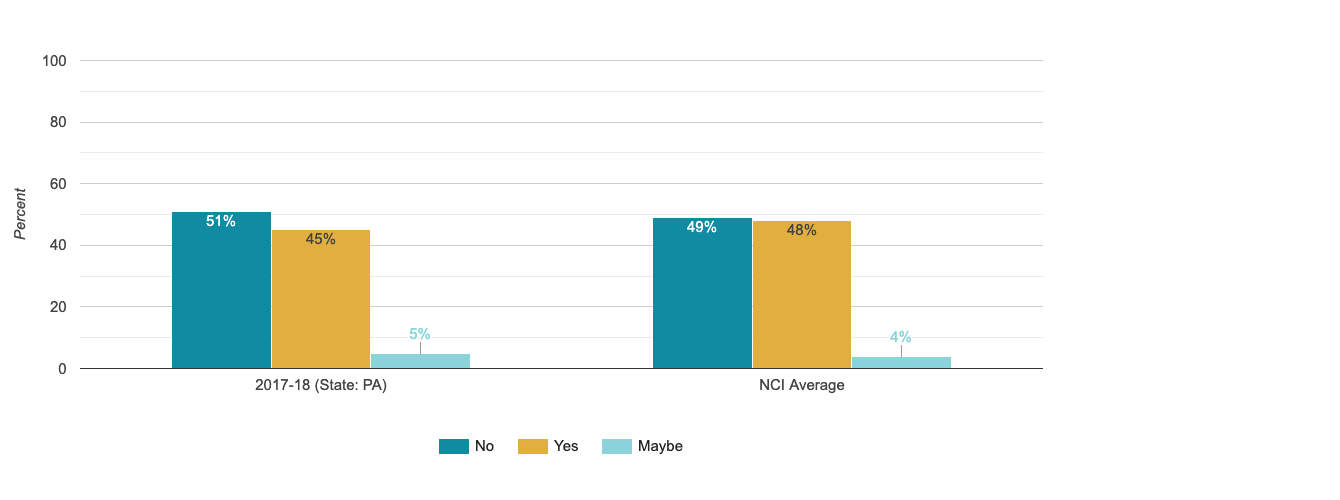
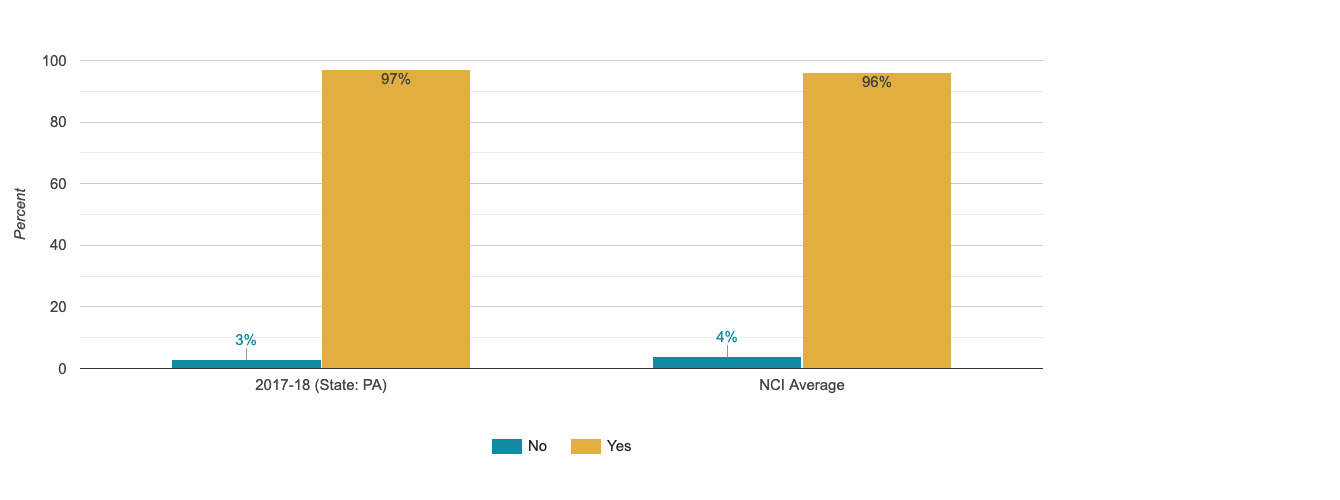
Chose Paid Community Job
Of those with a paid community job, the percentage of people who report having input in choosing paid community job
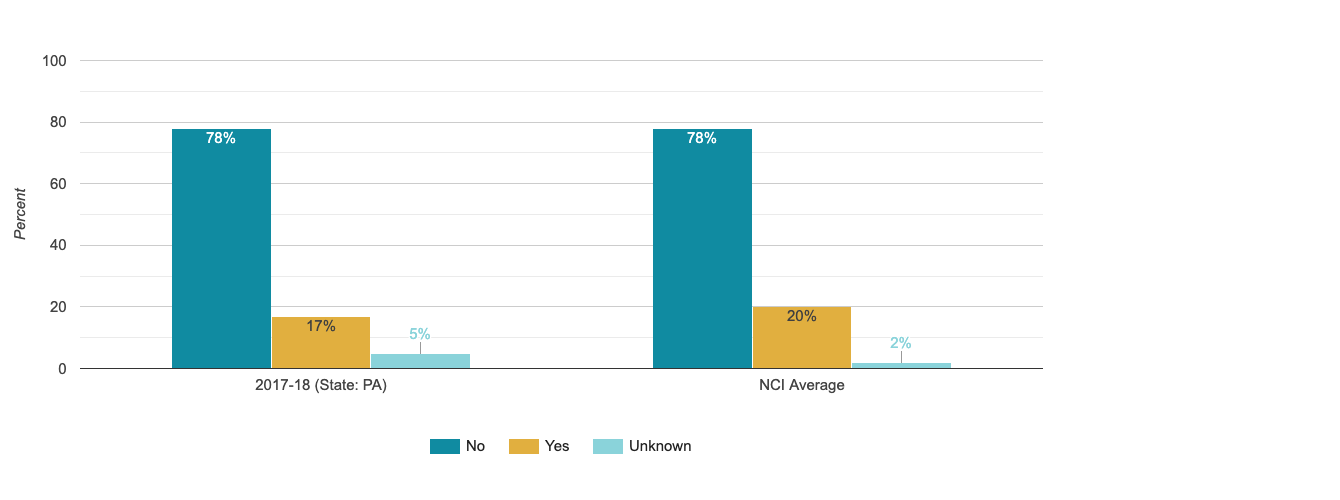
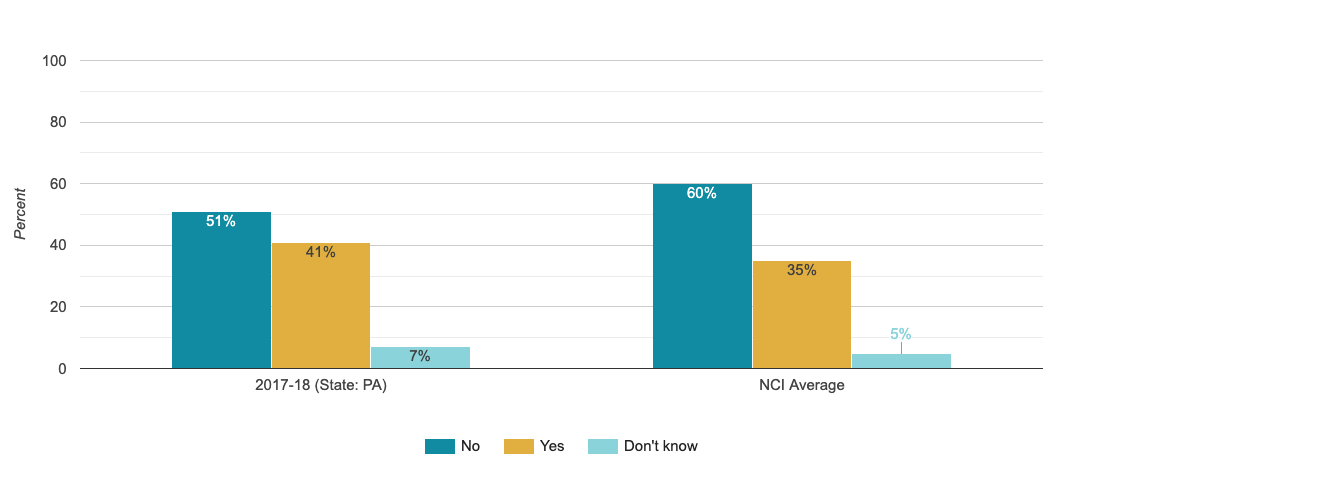
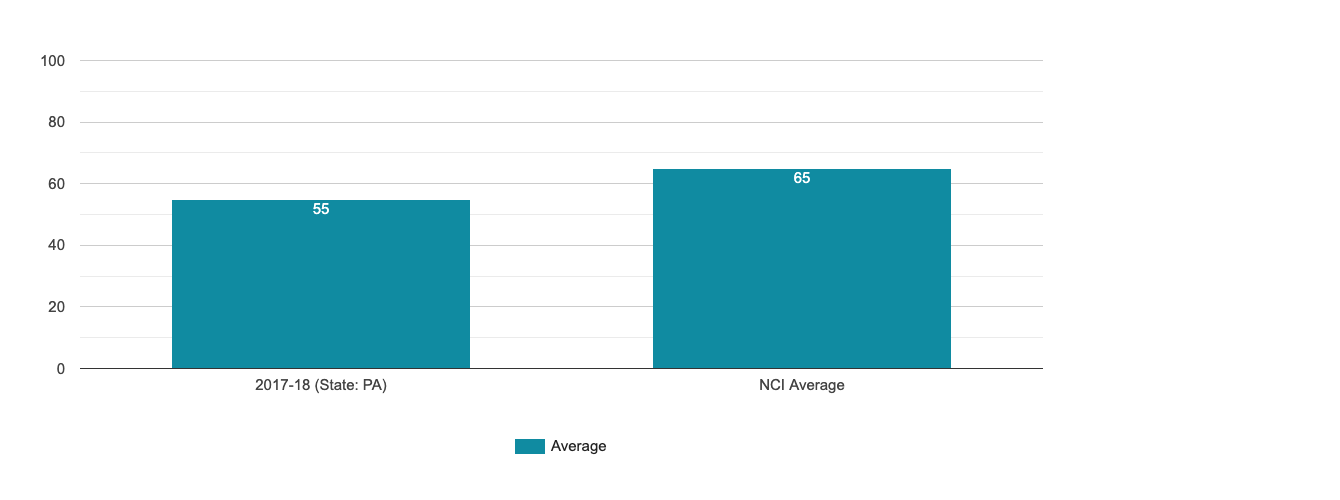
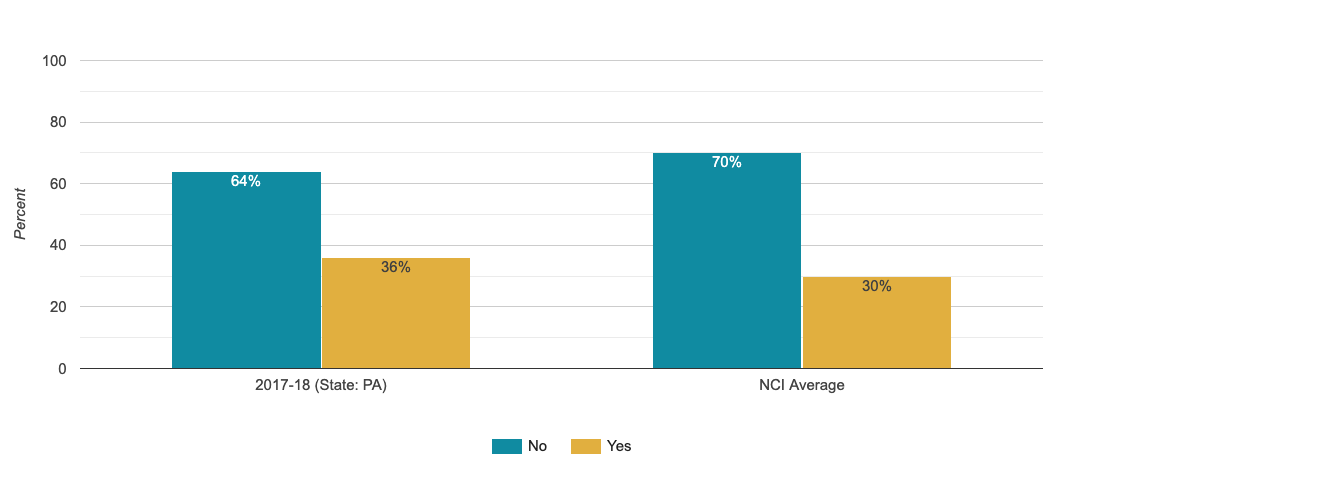
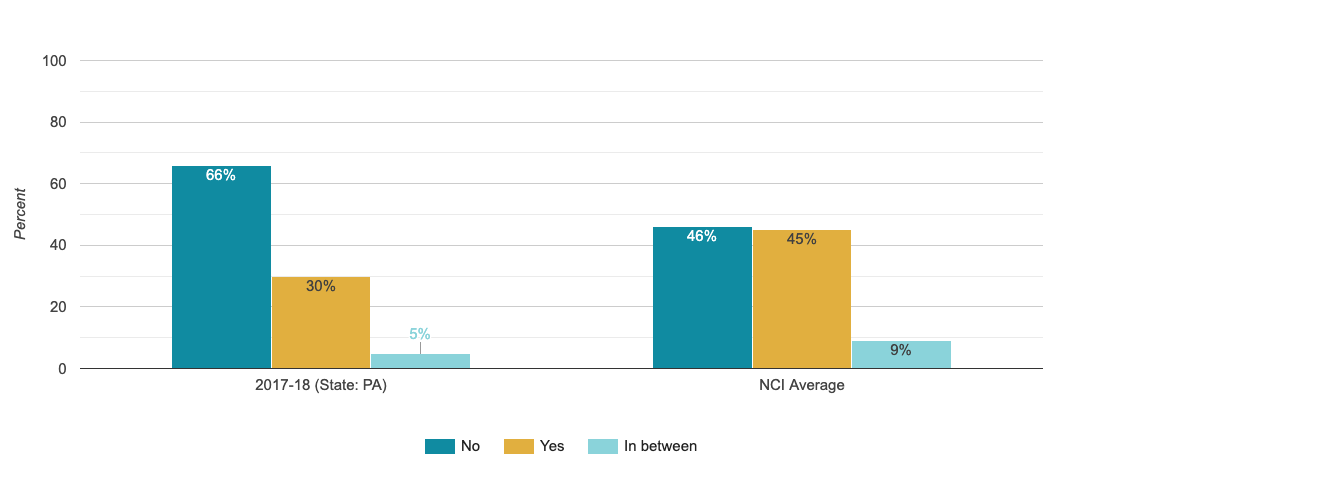
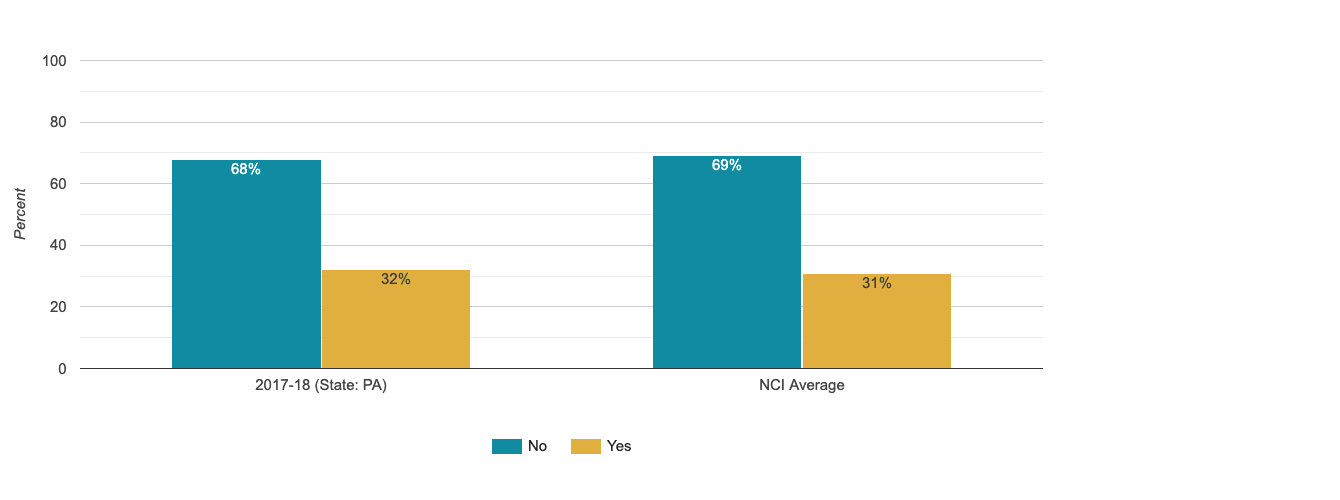
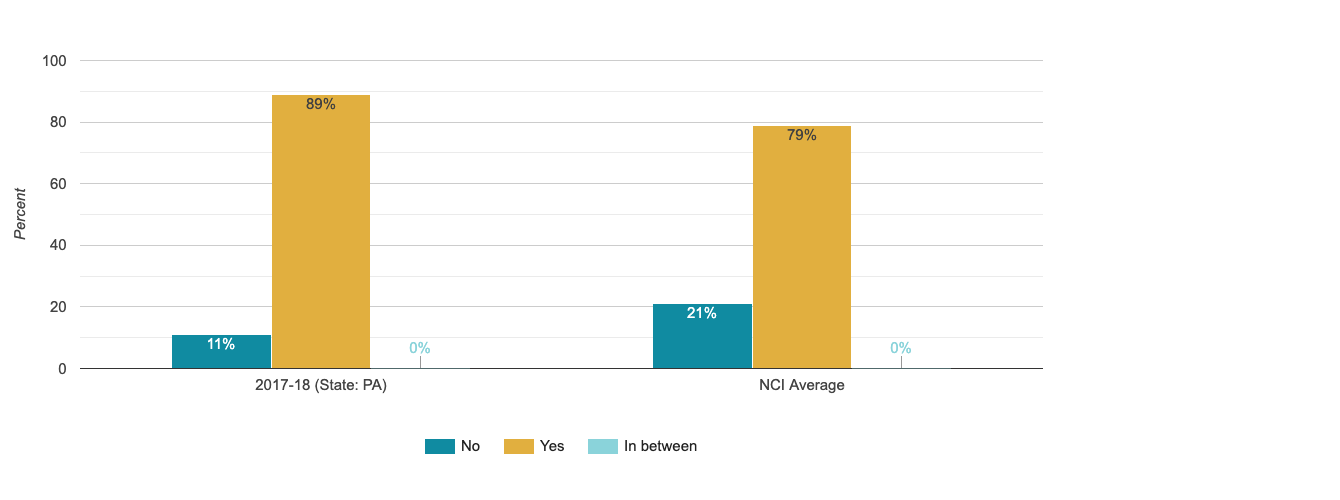
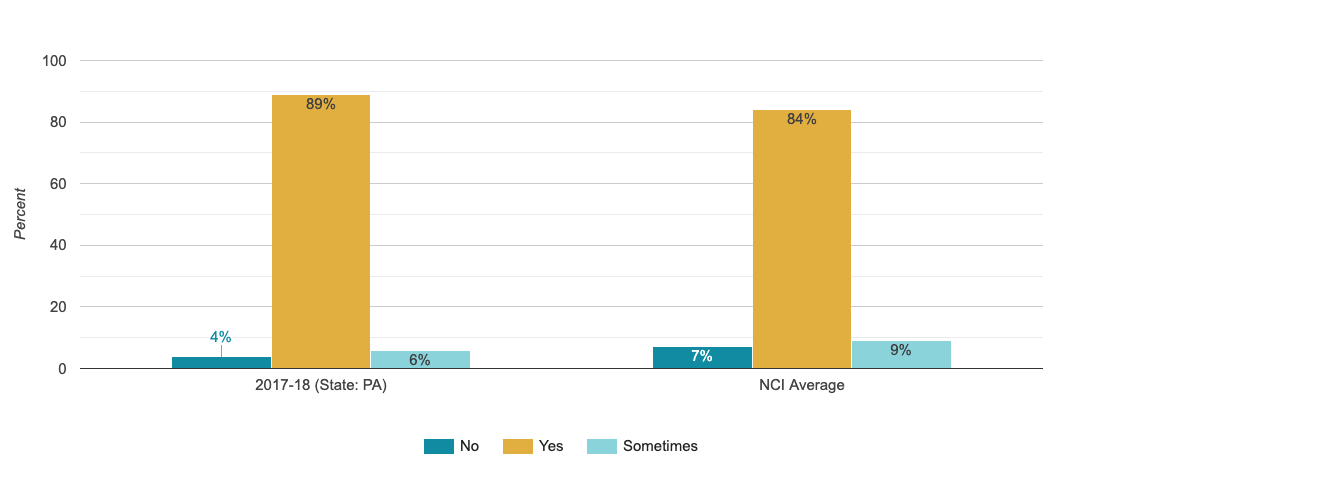
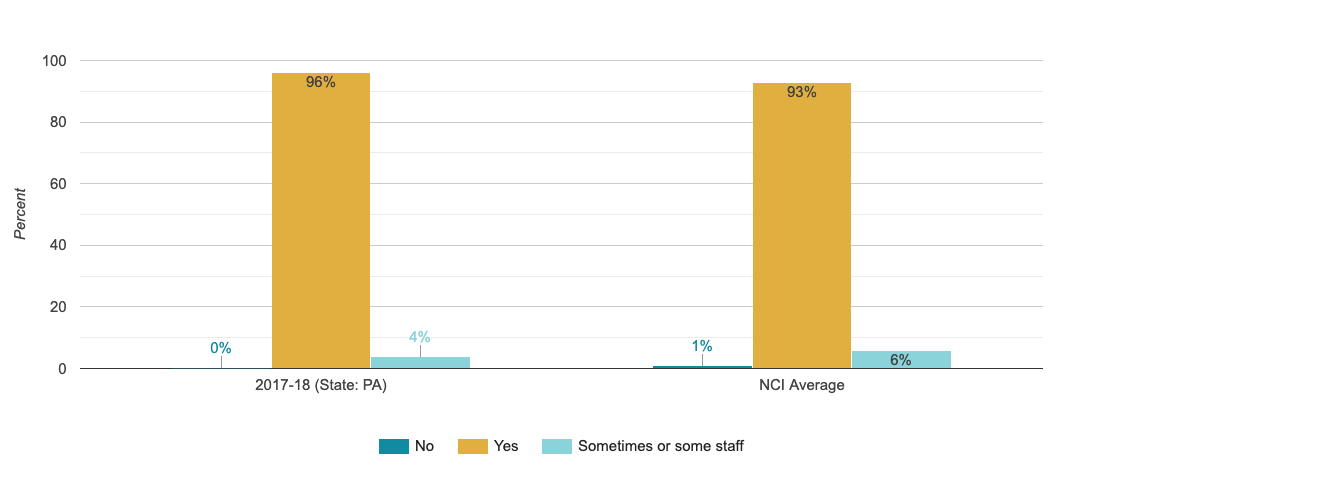
Chose Day Program or Regular Activity
The percentage of people who report having input in choosing day activities (in addition to or instead of paid community job)
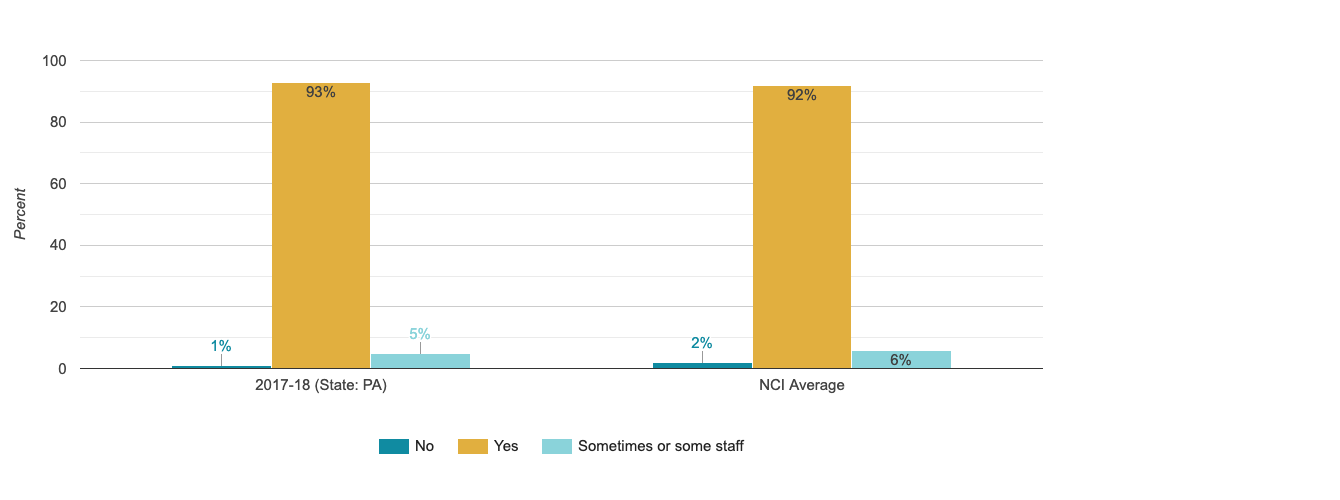
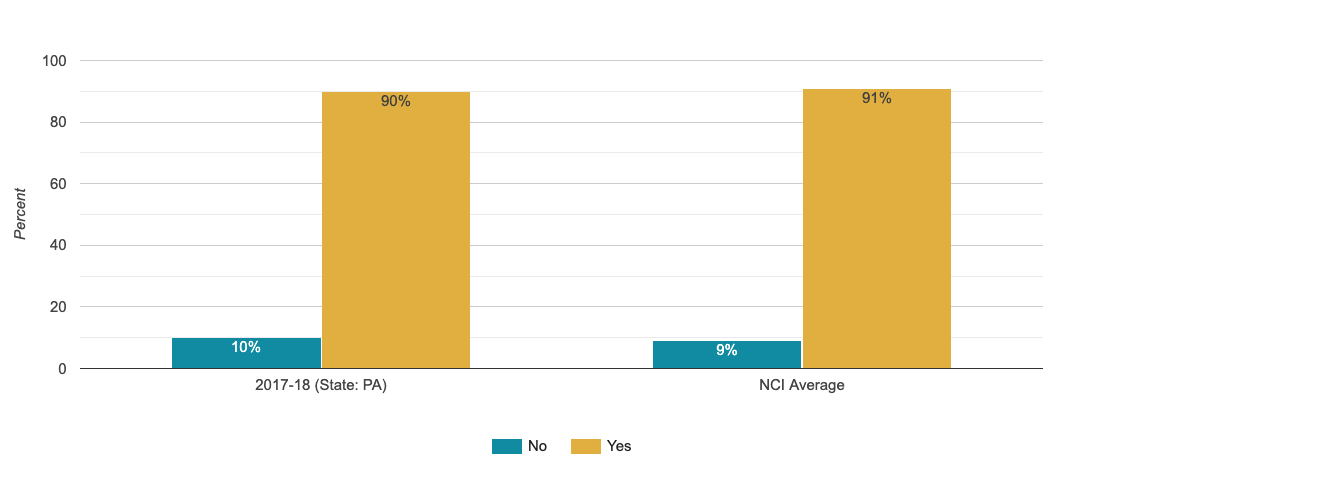
Chose Staff
The percentage of people who report having choice in their staff

Decides Daily Schedule
The percentage of people who decide or have input in deciding daily schedule
Decides How to Spend Free Time
The percentage of people who report having enough choice about what to do in their free time
Chooses How to Spend Money
The percentage of people who report having input in how they spend their money
Chose Case Manager/service Coordinator
Percentage of people who reported they could change their case manager/service coordinator
Work
People have support to find and maintain community integrated employment.
Paid Community Job
The percentage of those who are reported to have a paid job in the community; individual, group and/or in a business that primarily hires people with disabilities
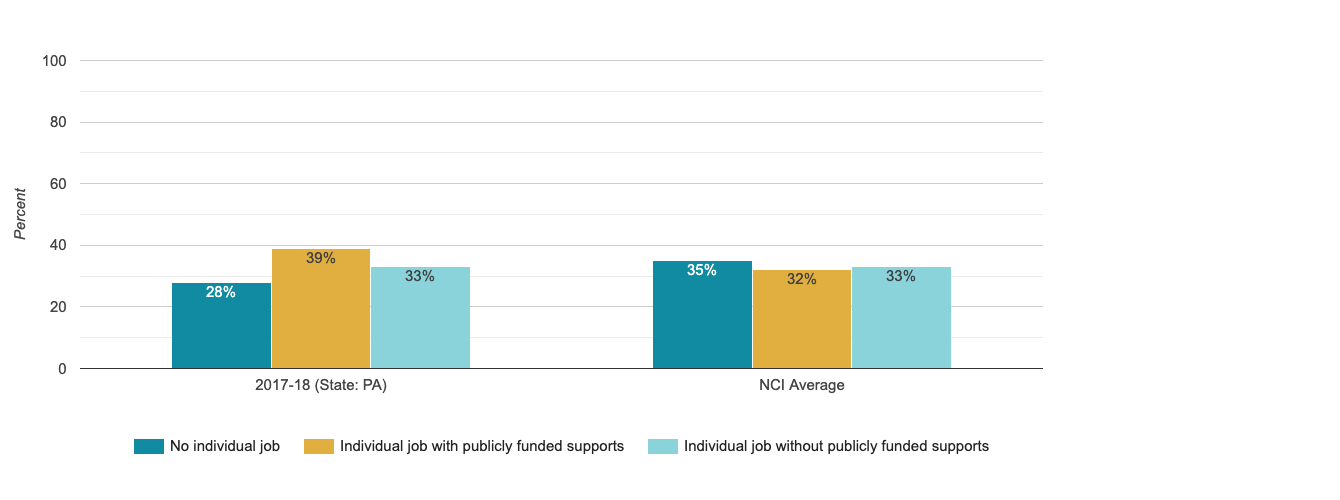
Paid Individual Community Job
Percentage of people who have a paid job in the community: Individual jobs
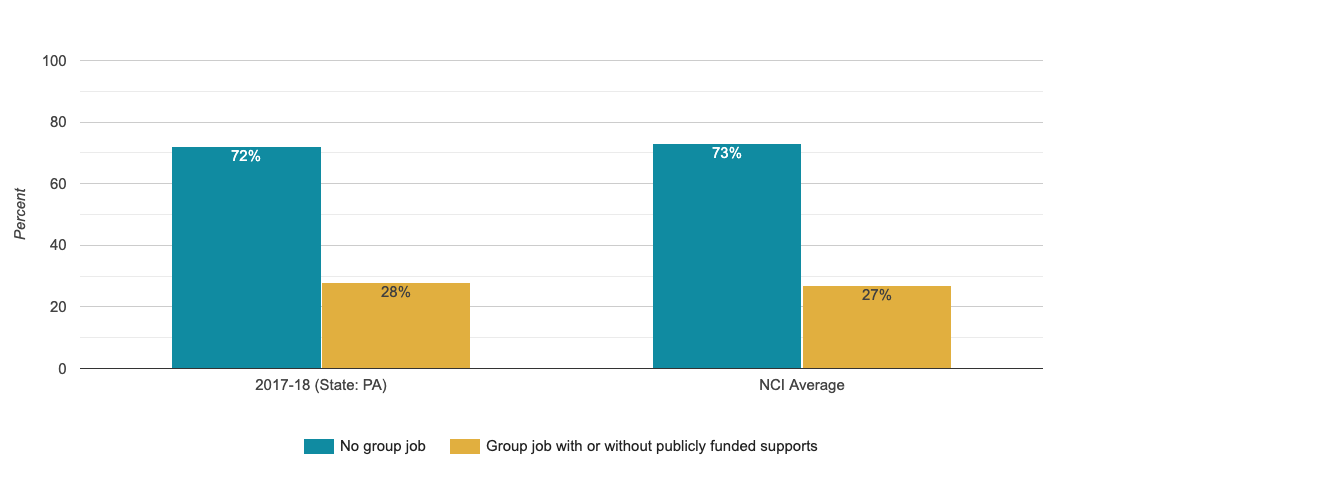
Paid Group Community Job
Percentage of people who have a paid job in the community: Group jobs
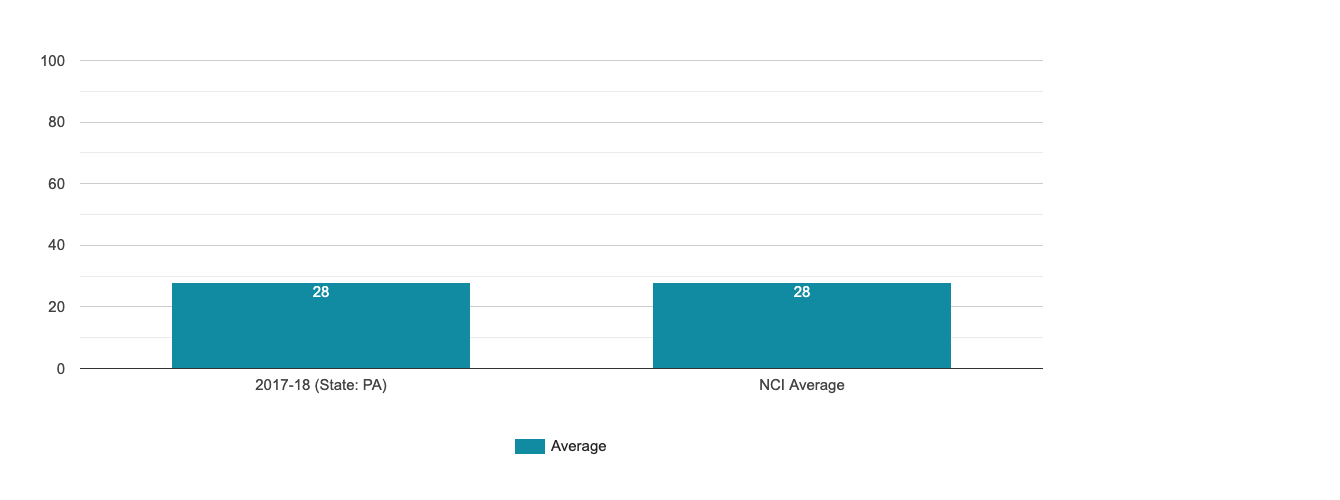
Hours - Individual Job With Publicly Funded Supports
Average number of bi-weekly hours, individual jobs with publicly funded supports
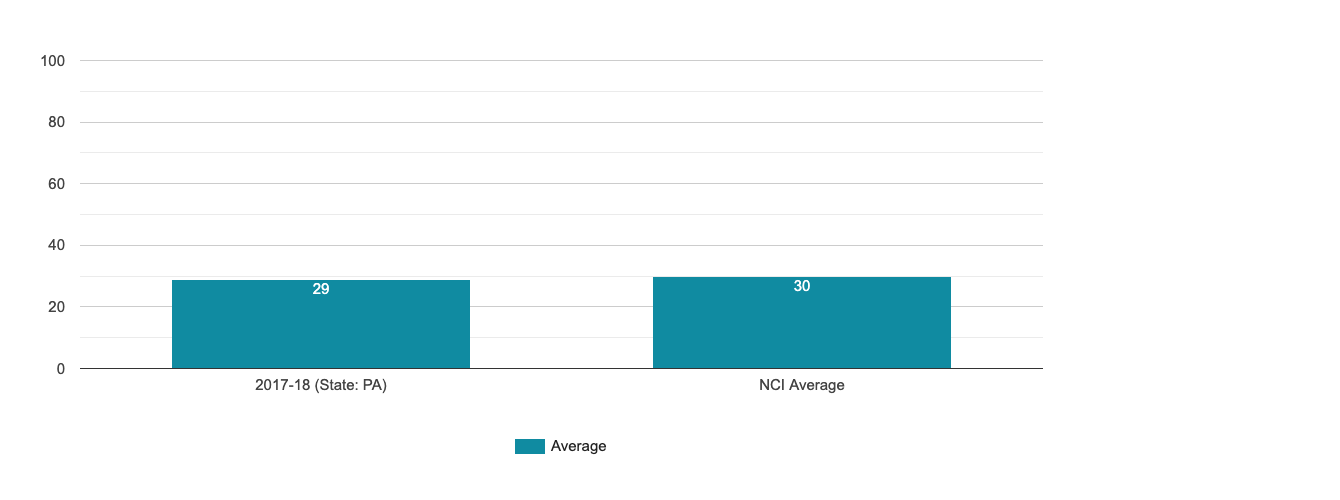
Hours - Individual Job Without Publicly Funded Supports
Average number of bi-weekly hours, individual job without publicly funded supports
Average Months of Employment at Current Paid Community Job
Average length of employment (months) in current job for people who were reported to have a job in the community
Receives Paid Vacation And/or Sick Time at Paid Community Job
Of people who have a paid job in the community, the percentage of people who are reported to receive vacation and/or sick time benefits
Job Industry - Food Preparation
The percentage of people who were reported to have a job in the community in different types of jobs: Food preparation and food service
Job Industry - Cleaning
The percentage of people who were reported to have a job in the community in different types of jobs: Building and grounds cleaning or maintenance

Job Industry - Personal Care Provider
The percentage of people who were reported to have a job in the community in different types of jobs: Personal care provider+D54

Job Industry - Retail
The percentage of people who were reported to have a job in the community in different types of jobs: Retail job such as sales clerk or stock person
Job Industry - General Office and Admin Support
The percentage of people who were reported to have a job in the community in different types of jobs: General office and administrative support

Job Industry - Farming, Fishing, Forestry
The percentage of people who were reported to have a job in the community in different types of jobs: Farming, fishing, forestry worker

Job Industry - Construction or Repair
The percentage of people who were reported to have a job in the community in different types of jobs: Construction or repair occupation
Job Industry - Assembly, Manufacturing
The percentage of people who were reported to have a job in the community in different types of jobs: Assembly, manufacturing or packaging

Job Industry - Materials Handling, Mail Distribution
The percentage of people who were reported to have a job in the community in different types of jobs: Materials handling, mail distrinution

Job Industry - Management, Business, Financial Operations
The percentage of people who were reported to have a job in the community in different types of jobs: Management, business or financial operations

Job Industry - Professional or Technical Occupation
The percentage of people who were reported to have a job in the community in different types of jobs: Professional or technical occupation
Job Industry - Other
The percentage of people who were reported to have a job in the community in different types of jobs: Other
Would Like a Paid Job in the Community
The percentage of people who are reported to not have a paid job in the community but report wanting a paid job in the community
Has Community Employment as a Goal in Service Plan
The percentage of people who are reported to have a goal of community employment in their individualized service plan
Takes Classes, Training or Do Something to Help Get a Job or a Better Job
The percentage of people who report taking part in activities to gain skills to expand job opportunities
Attends a Day Program or Regular Activity
The percentage of people who report participating in organized day activities (such as day program or sheltered workshop)
Volunteers
The percentage of people who report volunteering
Self-Determination
People have authority and are supported to direct and manage their own services.
Uses Self-Directed Supports Option
The percentage of people reported to be using a self-directed supports option
Participates in Budget Decisions
The percentage of people reported to be using a self-directed supports option who report that they participate in decisions about how service budget is used
Who Makes Budget Decisions
The percentage of people self-directing who reported they make decisions about how budget for services is used
Community Inclusion
People have support to participate in everyday community activities.
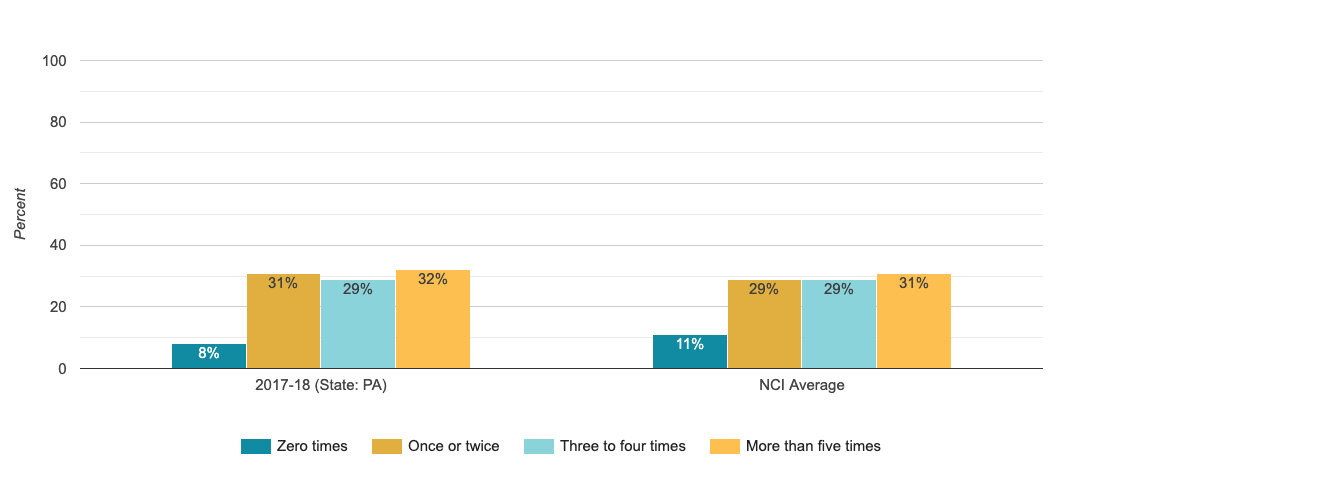
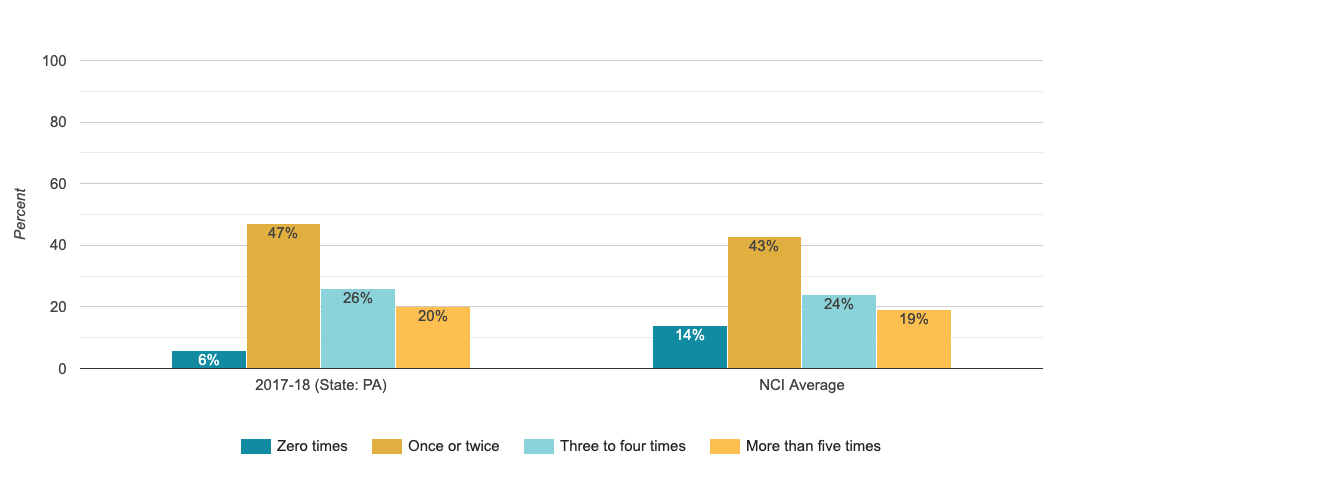
Went Shopping in the Past Month
The percentage of people who regularly participate in everyday integrated activities in their communities.
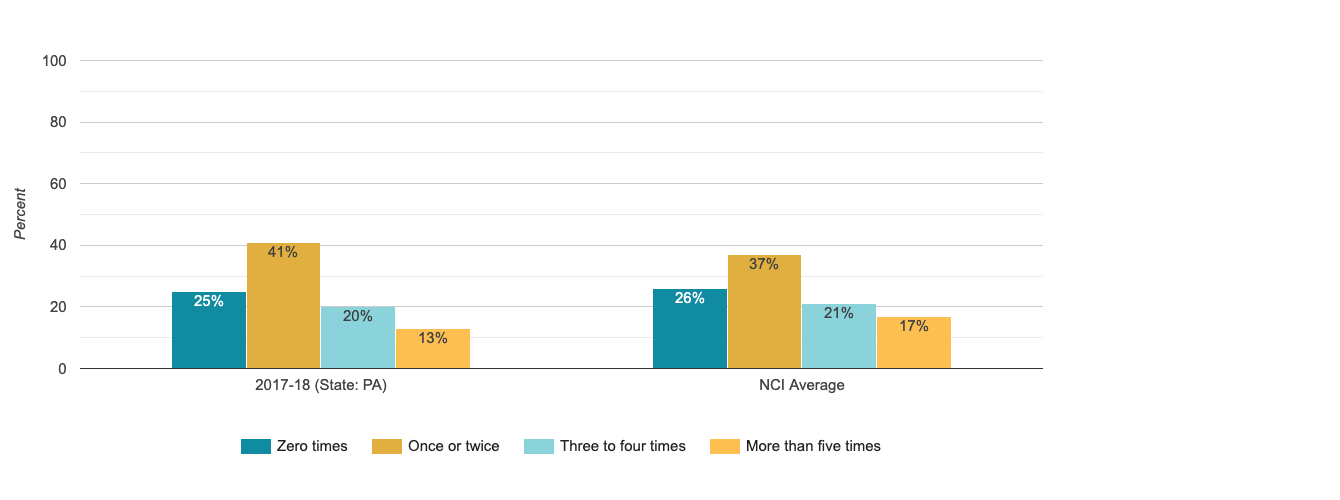
Went on Errands in the Past Month
The percentage of people who regularly participate in everyday integrated activities in their communities.
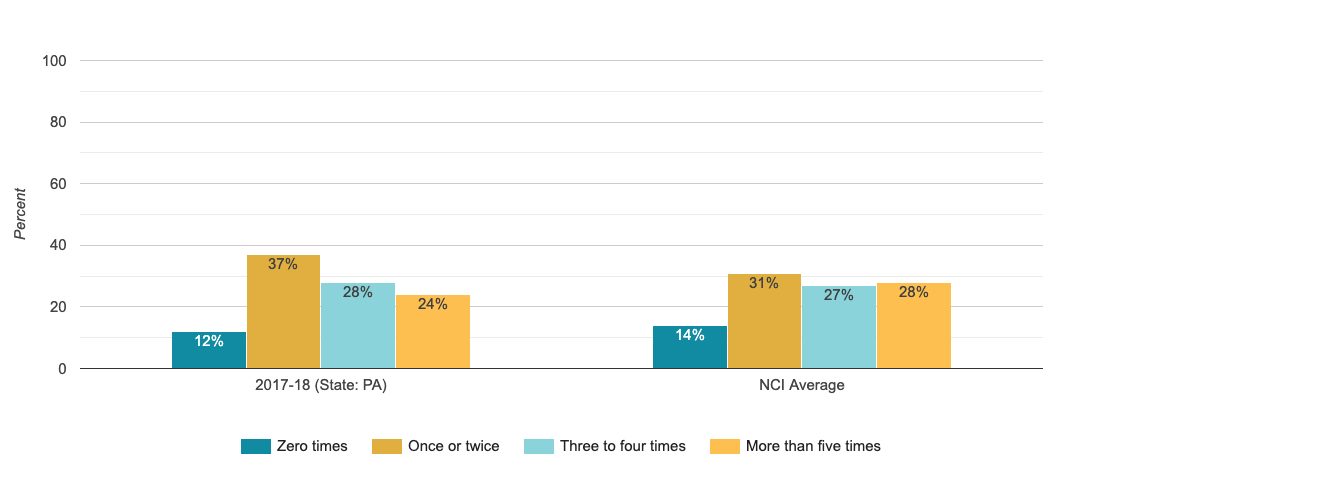
Went Out to Entertainment in the Past Month
The percentage of people who regularly participate in everyday integrated activities in their communities.
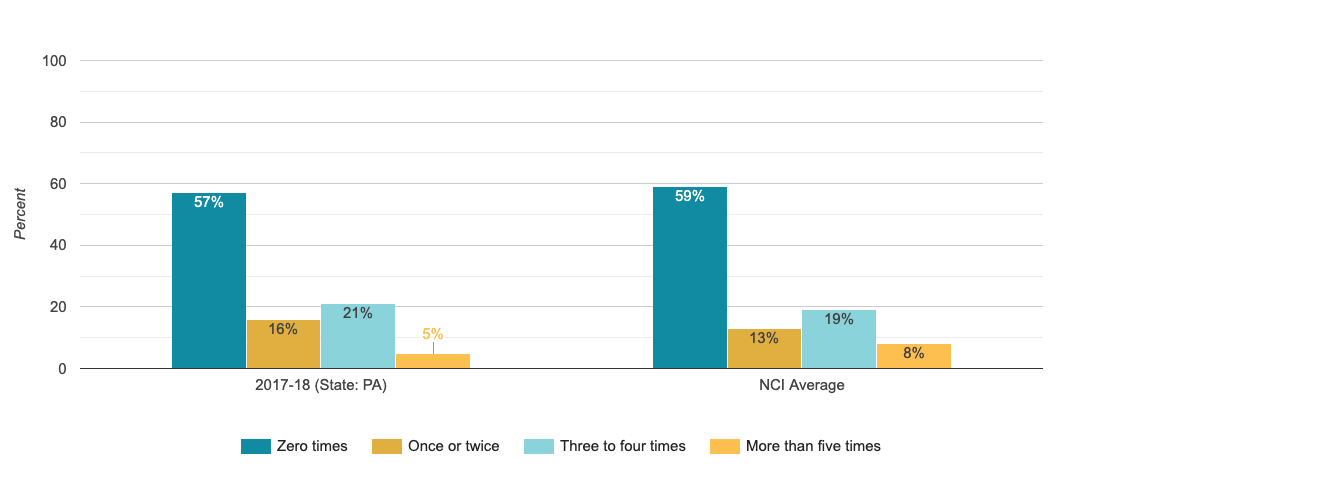
Went Out to Eat in the Past Month
The percentage of people who regularly participate in everyday integrated activities in their communities.
Went to a Religious Service or Spiritual Practice in the Past Month
The percentage of people who regularly participate in everyday integrated activities in their communities.
Participates in Community Groups
The percentage of people who regularly participate in everyday integrated activities in their communities.
Went on Vacation in the Past Year
The percentage of people who regularly participate in everyday integrated activities in their communities.
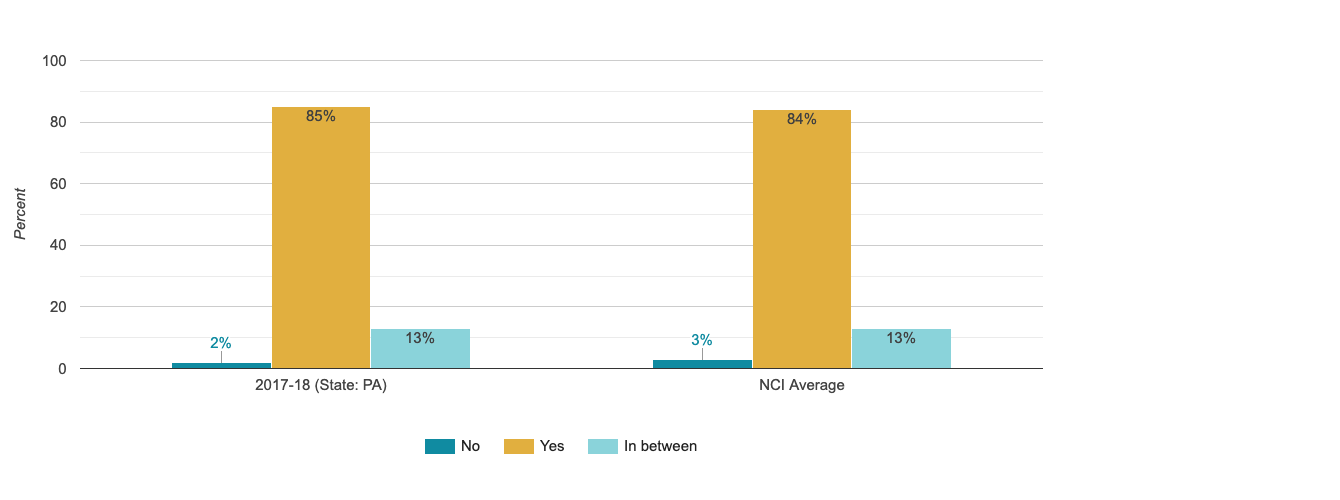
Able to Go Out and Do the Things They Like to Do
Percentage of people who report being able to go out and do the things they like to do
Able to Go Out and Do the Things They Like to Do Enough
Percentage of people who report being able to go out and do the things they like to do enough
Has Enough Things to Do at Home
Percentage of people who report that they have enough things to do at home
Relationships
People have friends and relationships.
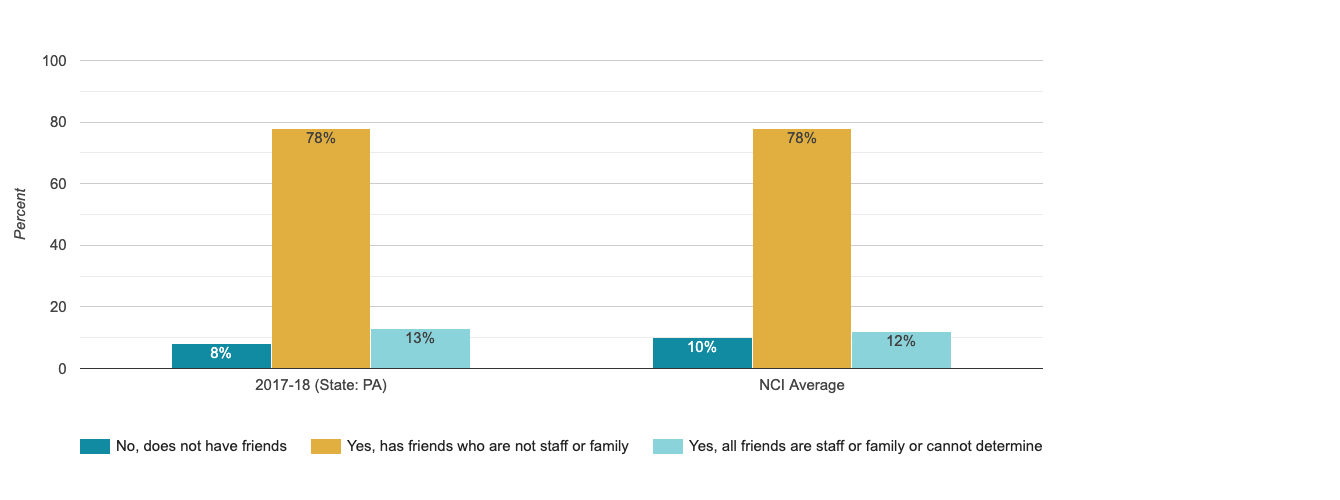
Has Friends
The percentage of people who report having friendships with people other than staff or family members
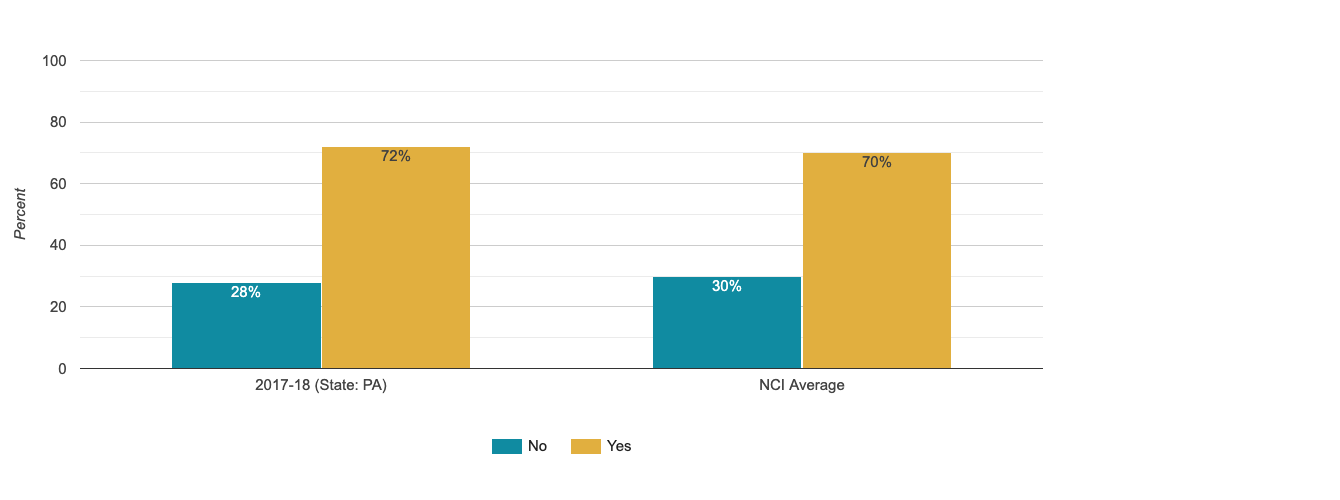
Has a Best Friend
The percentage of people who report having a best friend, or someone they are close to
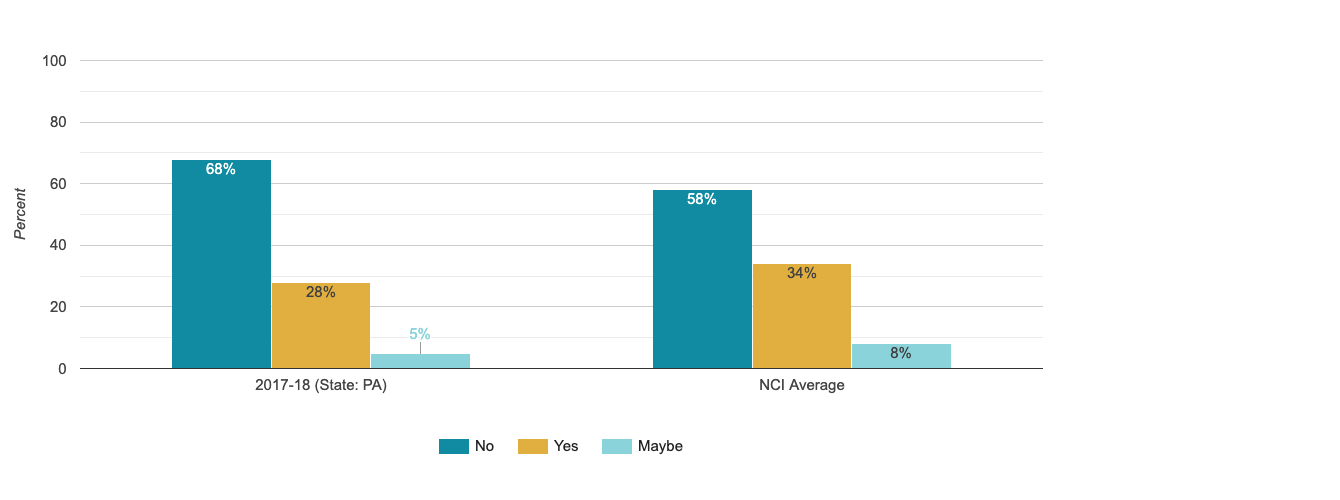
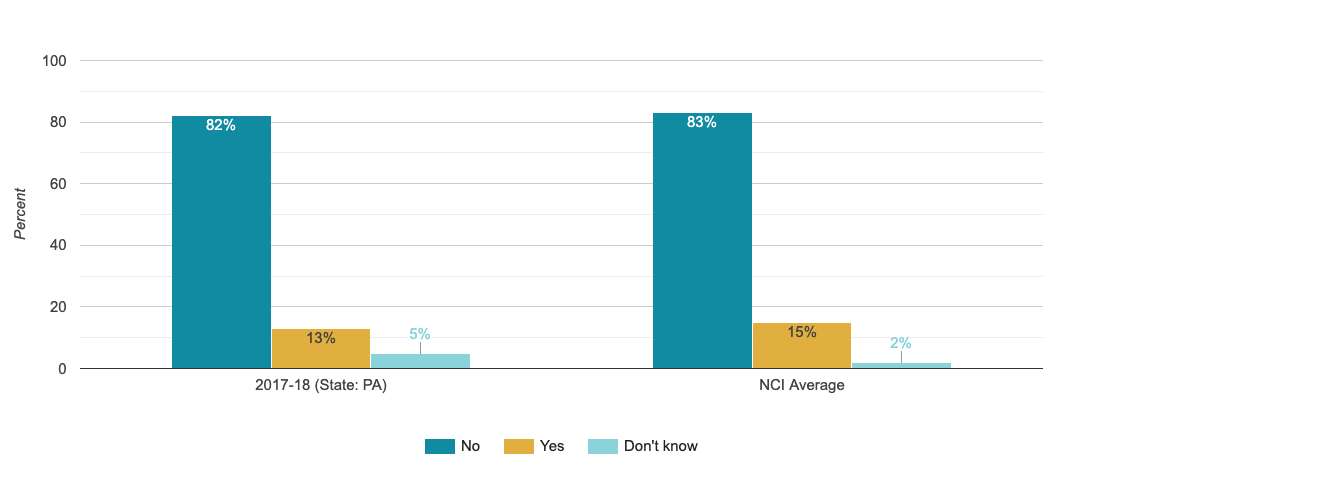
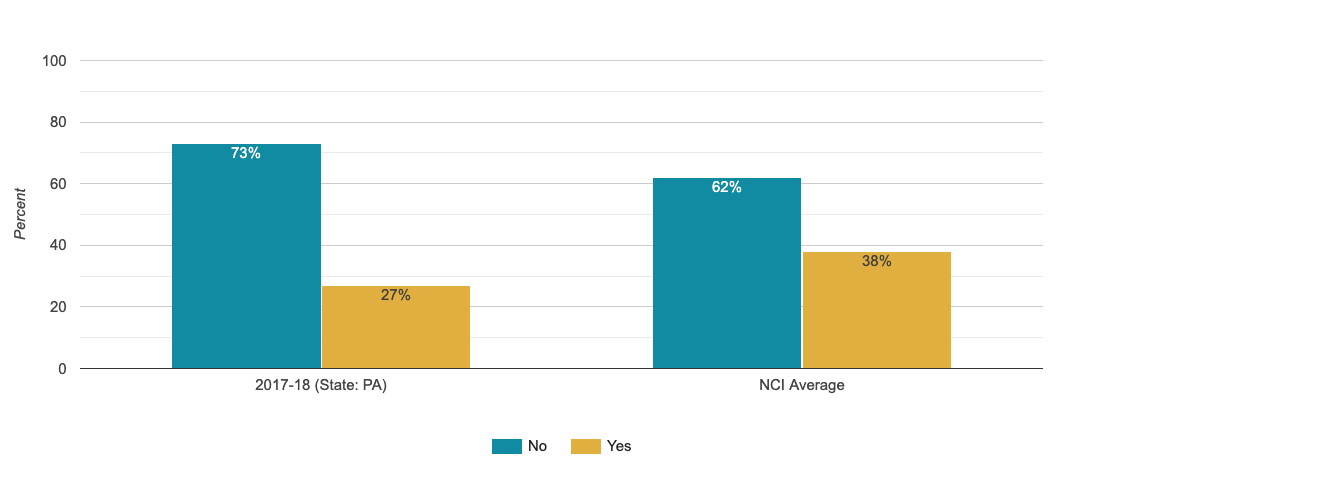
Wants More Help to Keep in Touch With Friends
The percentage of people who report that they would like help to make or keep in contact with friends
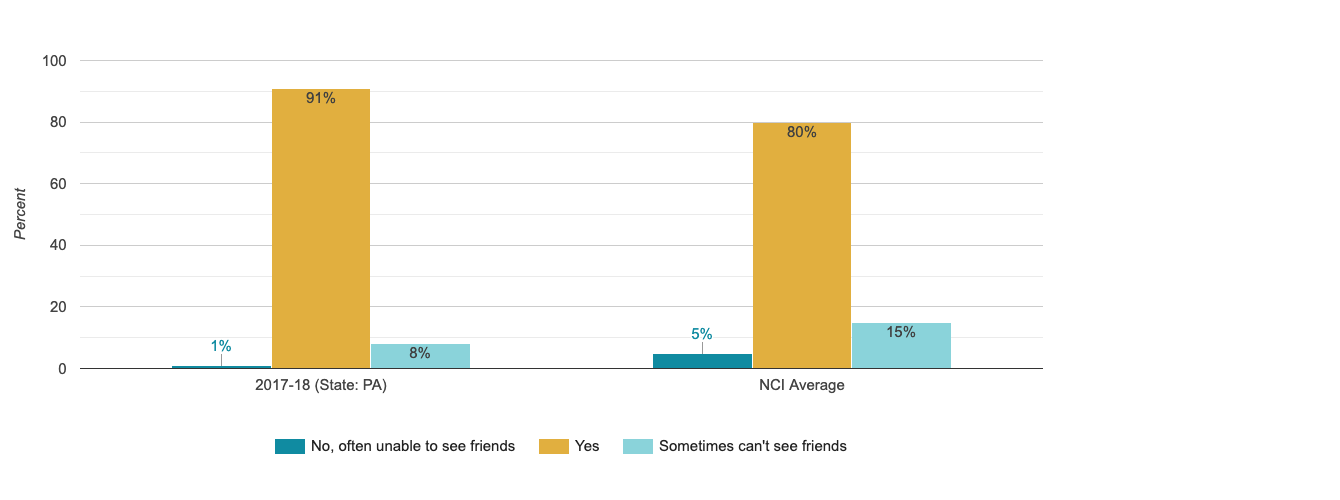
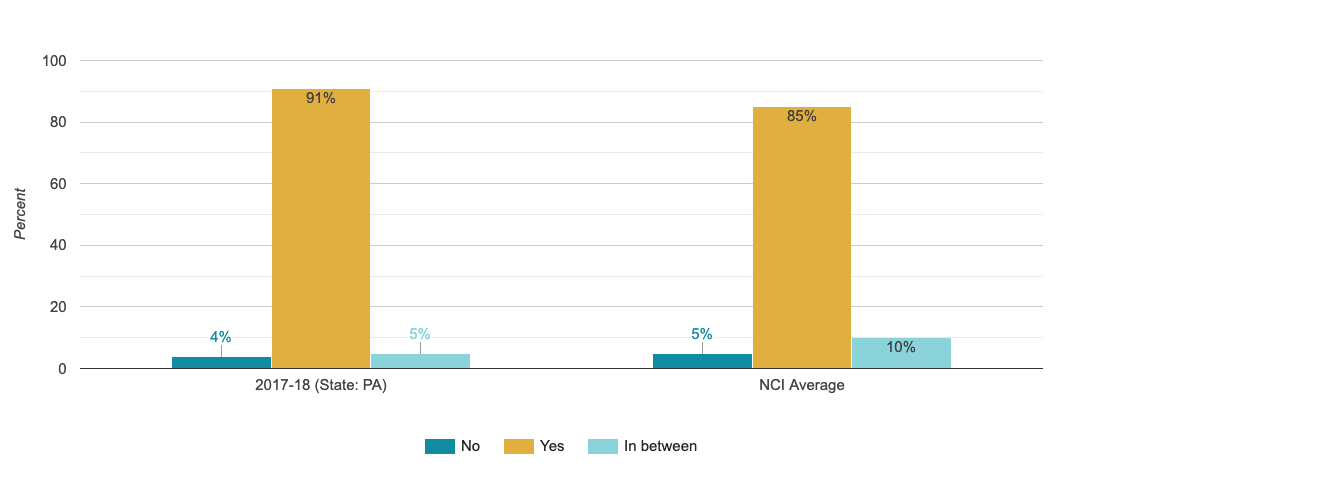
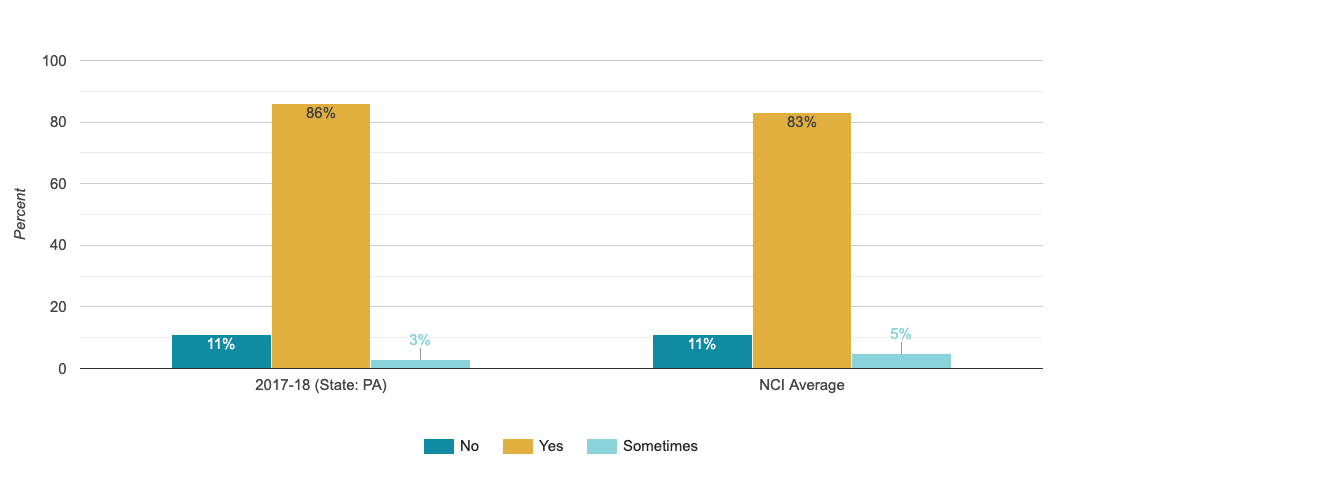
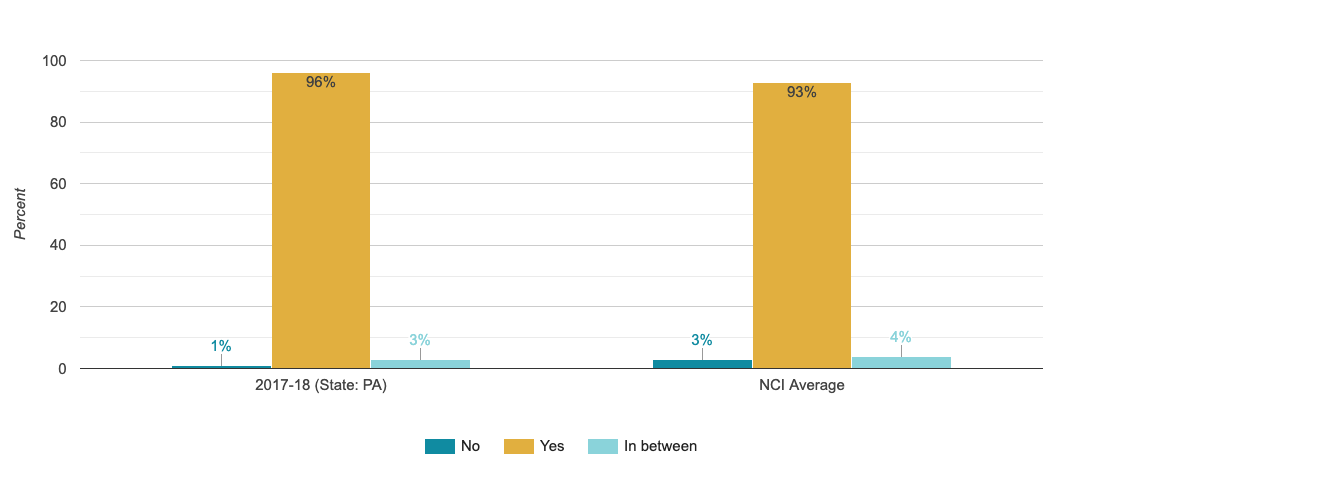
Can See Friends
The percentage of people who report being able to see and/or communicate with their friends when they want
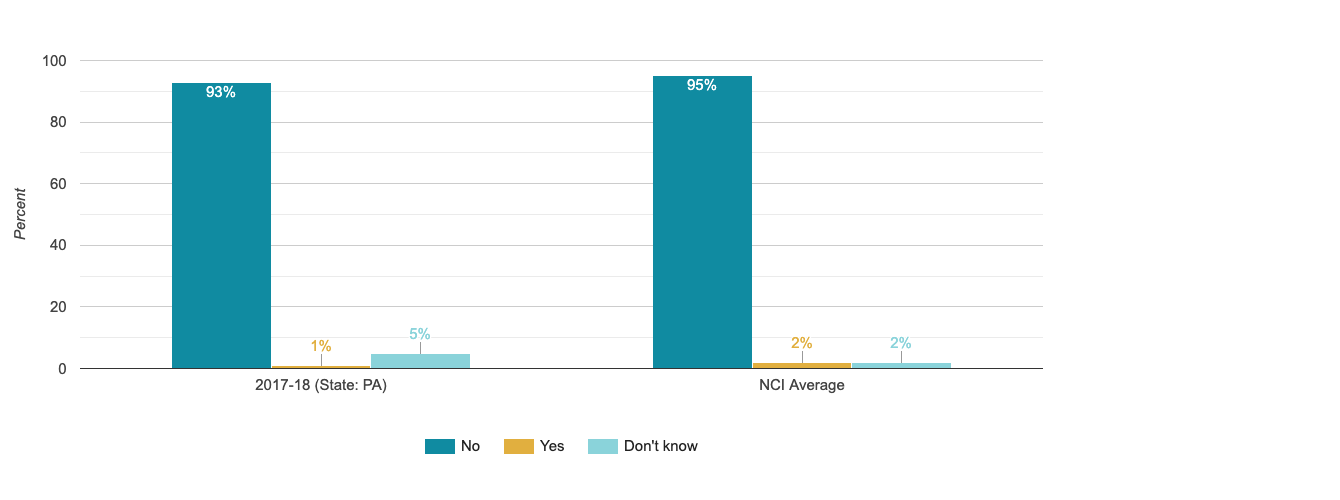
Reasons Cannot See Friends - Lack of Transportation
Percentage of people who reported they have friends (may be staff or family) and the support needed to see their friends when they want to
Reasons Cannot See Friends - Lack of Support Staff
Percentage of people who reported they have friends (may be staff or family) and the support needed to see their friends when they want to

Reasons Cannot See Friends - Rules or Restrictions About Seeing Friends
Percentage of people who reported they have friends (may be staff or family) and the support needed to see their friends when they want to

Reasons Cannot See Friends - Money/cost of Going Out
Percentage of people who reported they have friends (may be staff or family) and the support needed to see their friends when they want to

Reasons Cannot See Friends - Difficulty Finding a Time to Get Together
Percentage of people who reported they have friends (may be staff or family) and the support needed to see their friends when they want to
Reasons Cannot See Friends - Other
Percentage of people who reported they have friends (may be staff or family) and the support needed to see their friends when they want to
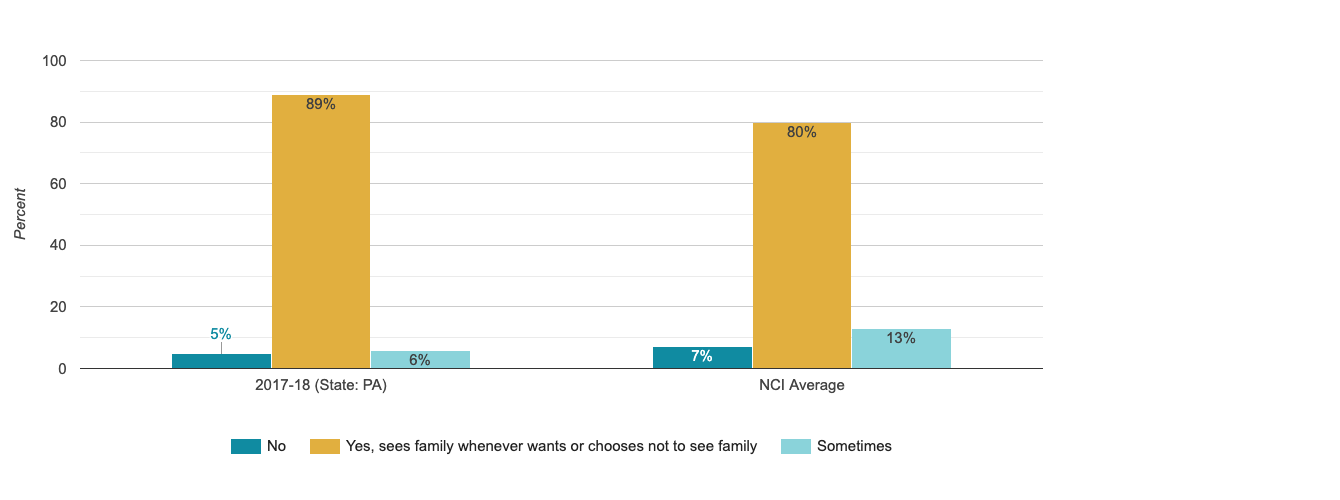
Can See Family
The percentage of people who report being able to see and/or communicate with their families when they want
Has Other Ways of Communicating With Friends
The percentage of people who report that they have ways to maintain contact with friends when they cannot see them in person
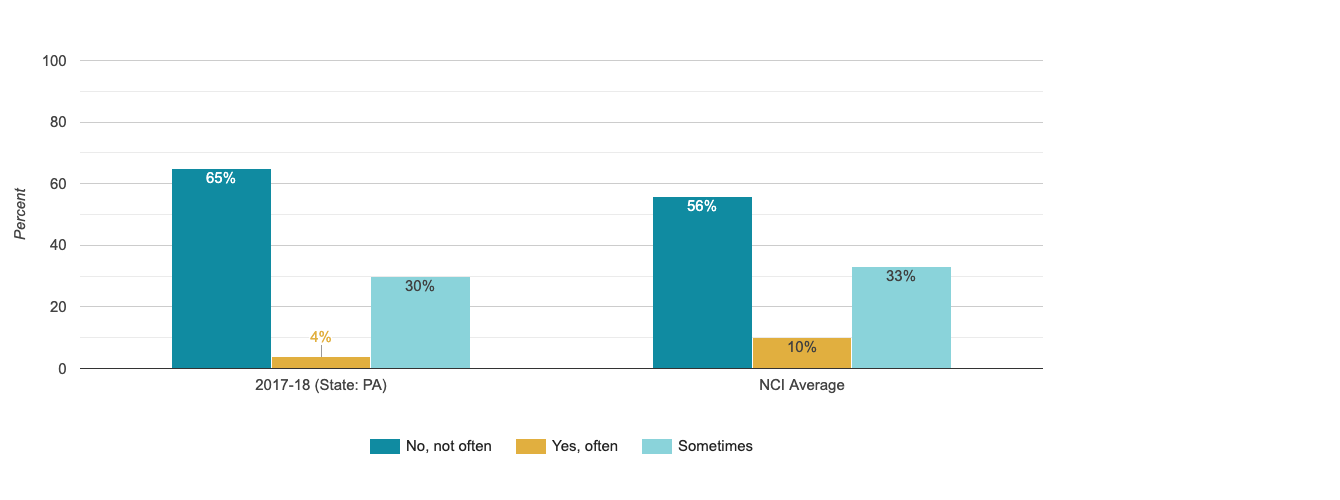
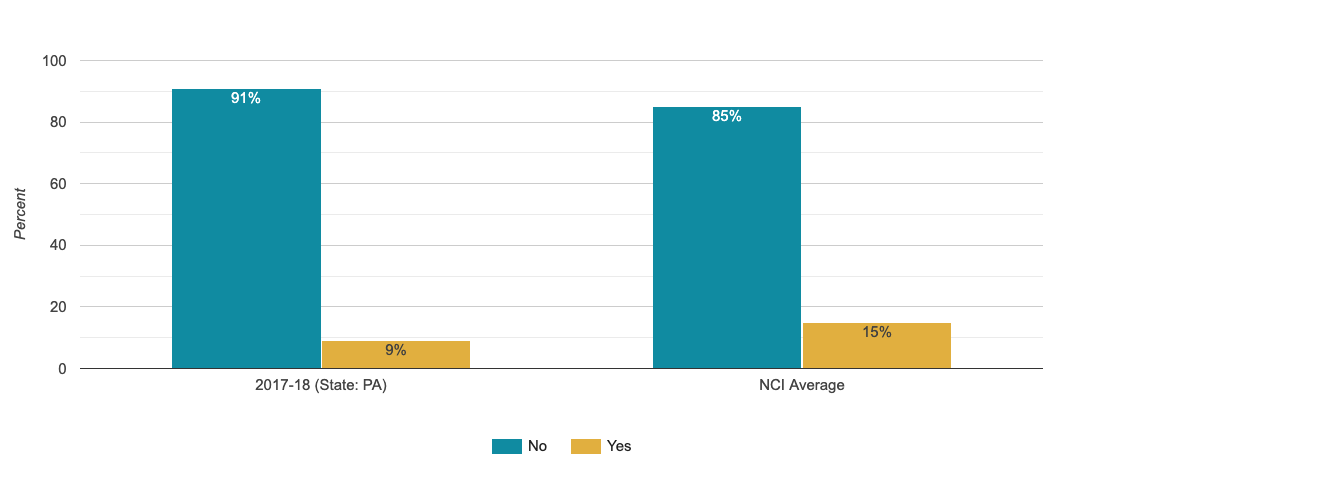
Feels Lonely
The percentage of people who report often feeling lonely
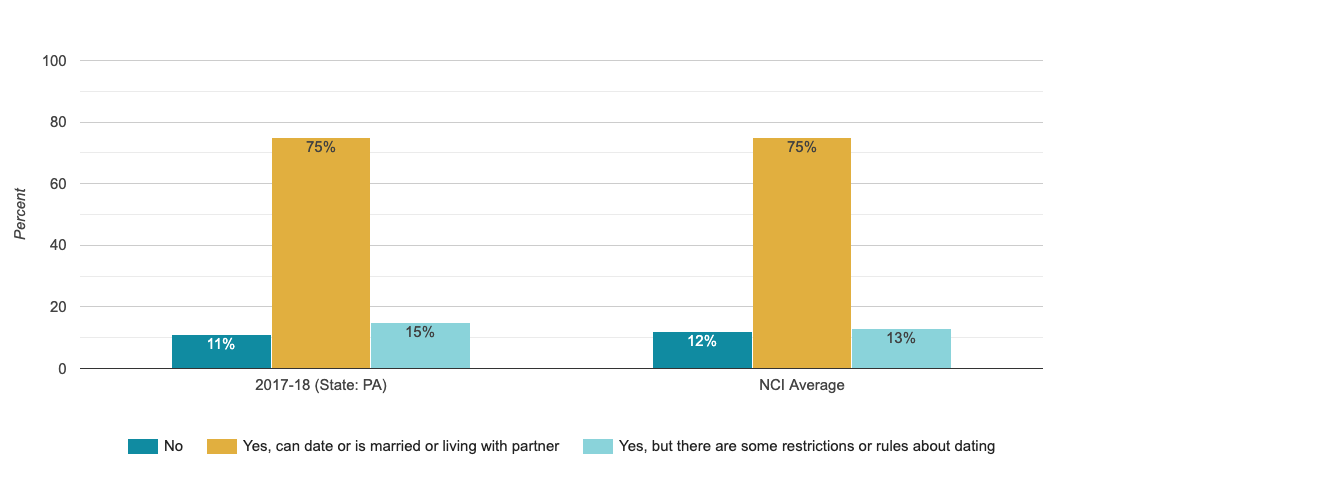
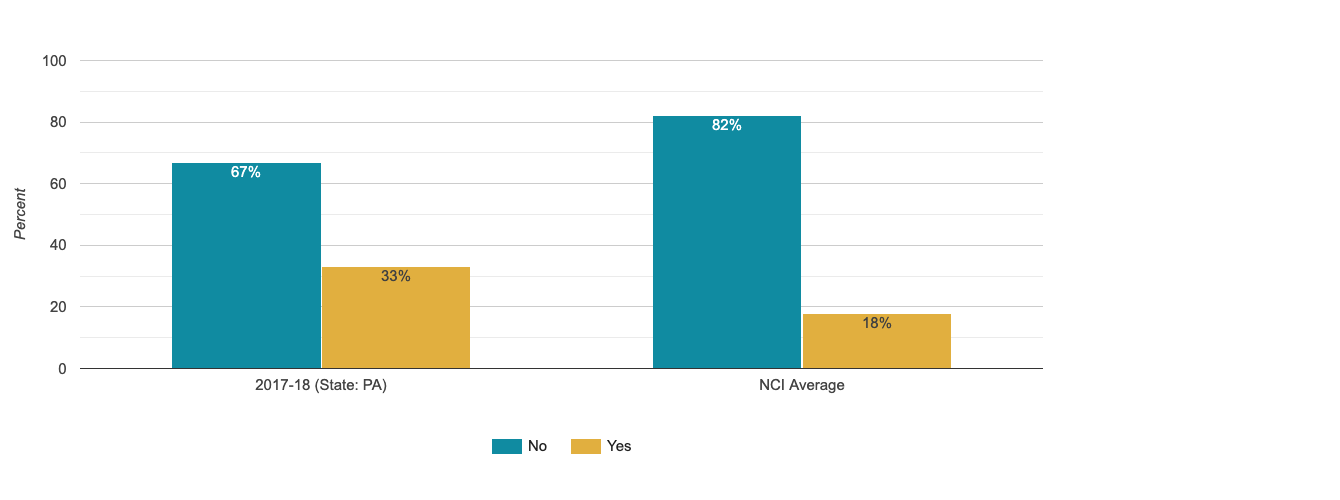
Can Date
The percentage of people who report being able to go on a date if they want to or report being married and/or living with partner
Satisfaction
People are satisfied with the services and supports they receive.
Families/family members with disabilities receive adequate and satisfactory supports.
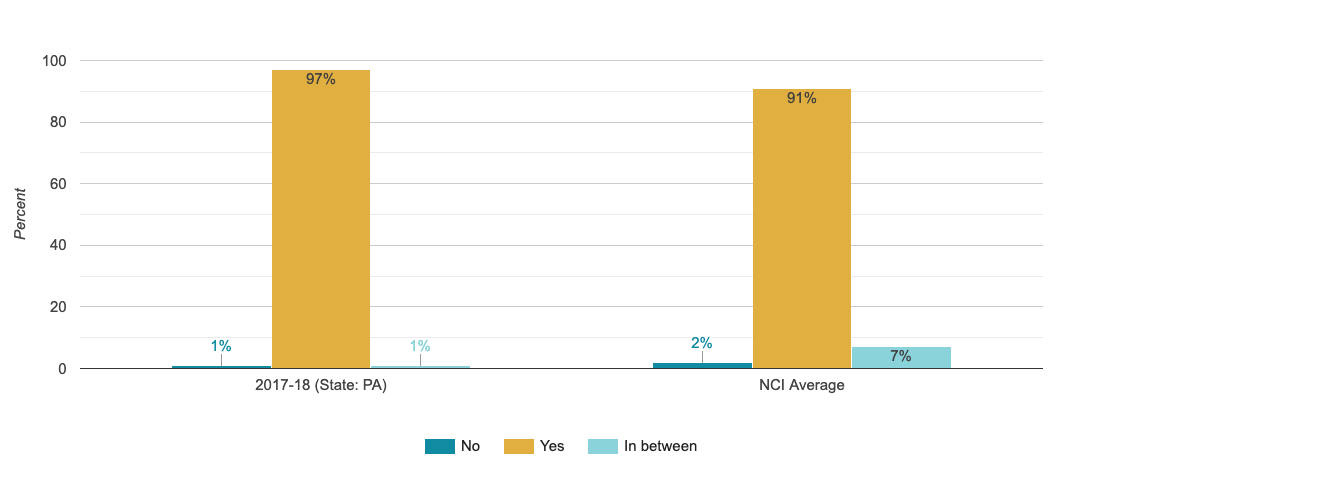
Likes Home
The percentage of people who report liking where they live
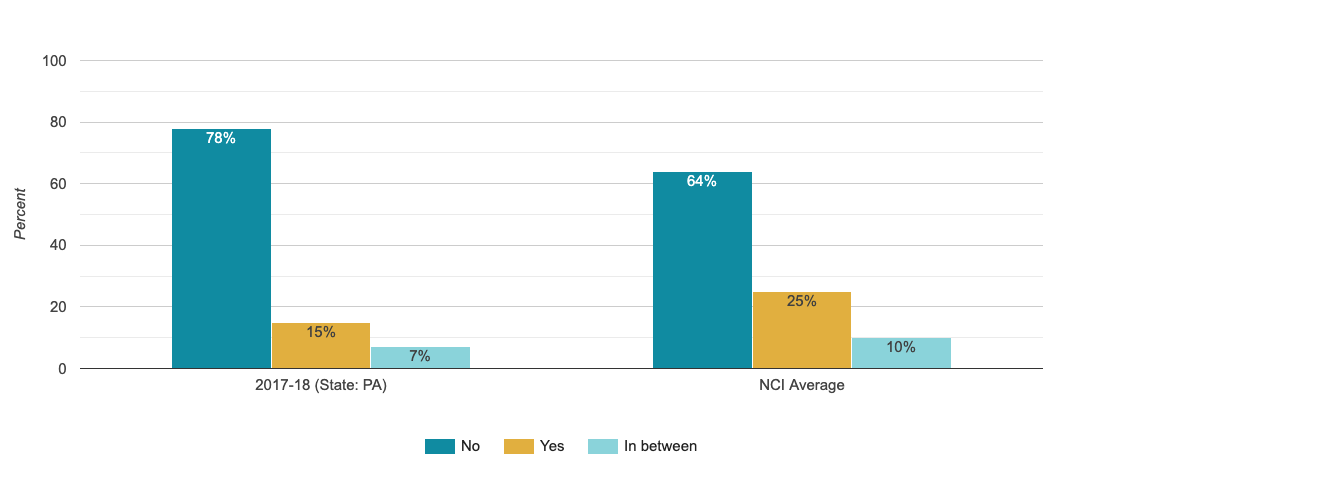
Wants to Live Somewhere Else
The percentage of people who report that they would like to live somewhere else
Likes Paid Community Job
The percentage of people reported to have a paid job in the community who report that they are satisfied with their job
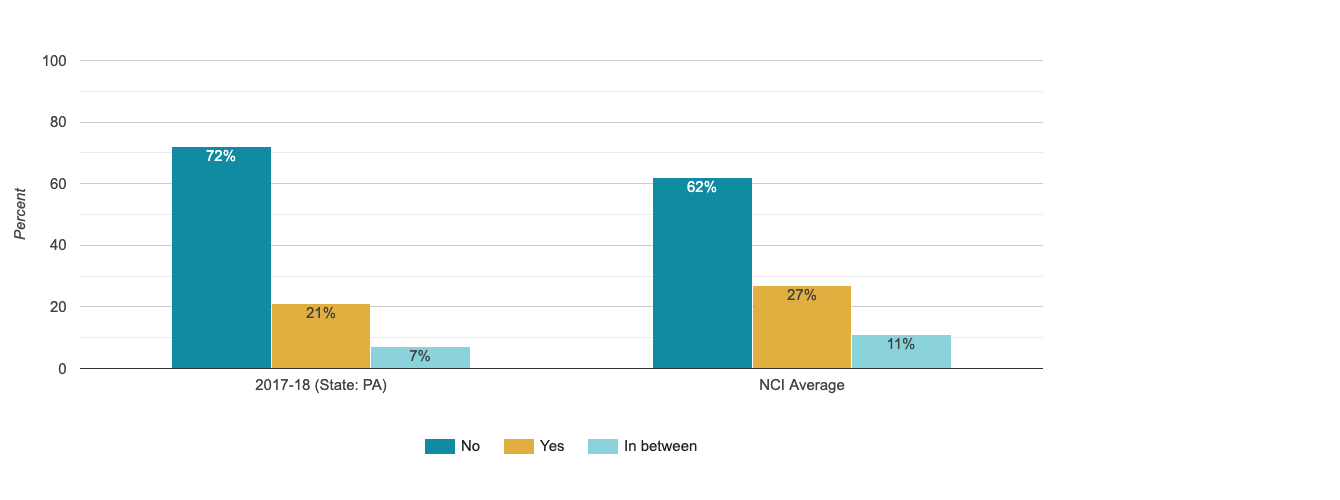
Wants to Work Somewhere Else
The percentage of people reported to have a paid job in the community who report that they would like to work somewhere else
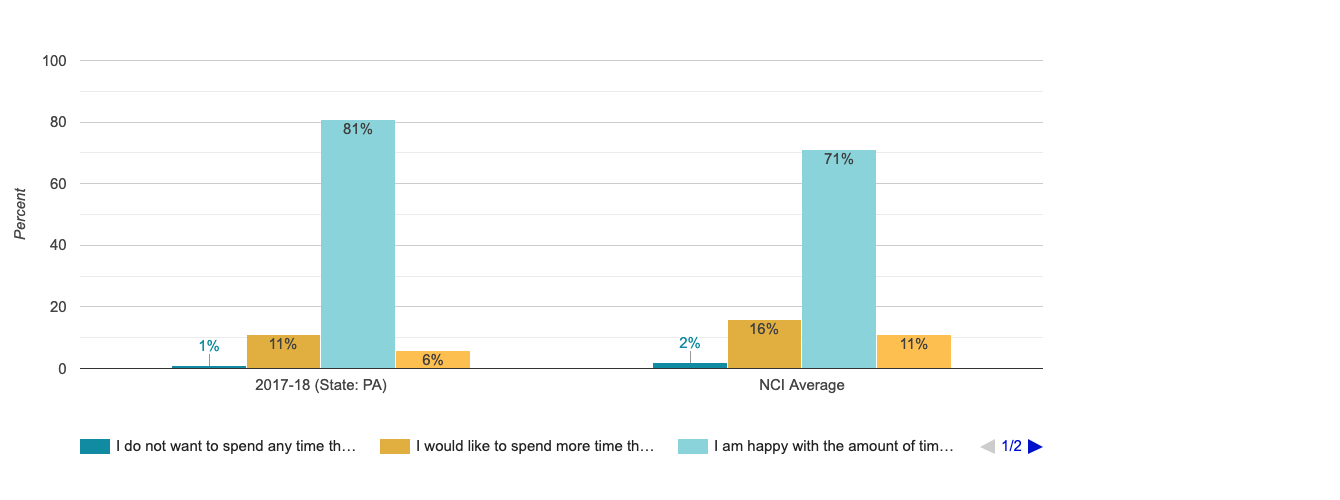
Would Like to Go to Day Program or Activity Less Than Goes Now
The percentage of people who report attending a day program or workshop and are satisfied with the amount of time spent there.
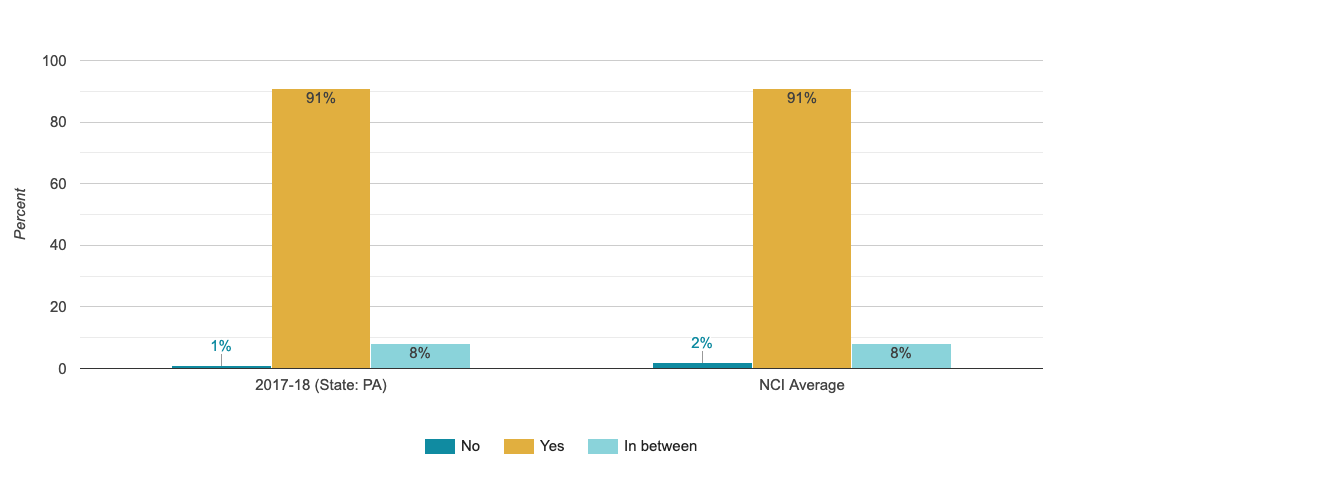
Services and Supports Are Helping to Live a Good Life
Percentage of people who reported that their services and supports are helping them to live a good life
Service Coordination
Service coordinators are accessible, responsive, and support the person’s participation in service planning.

Met Case Manager/service Coordinator
Percentage of people who reported they met their service coordinator/case manager
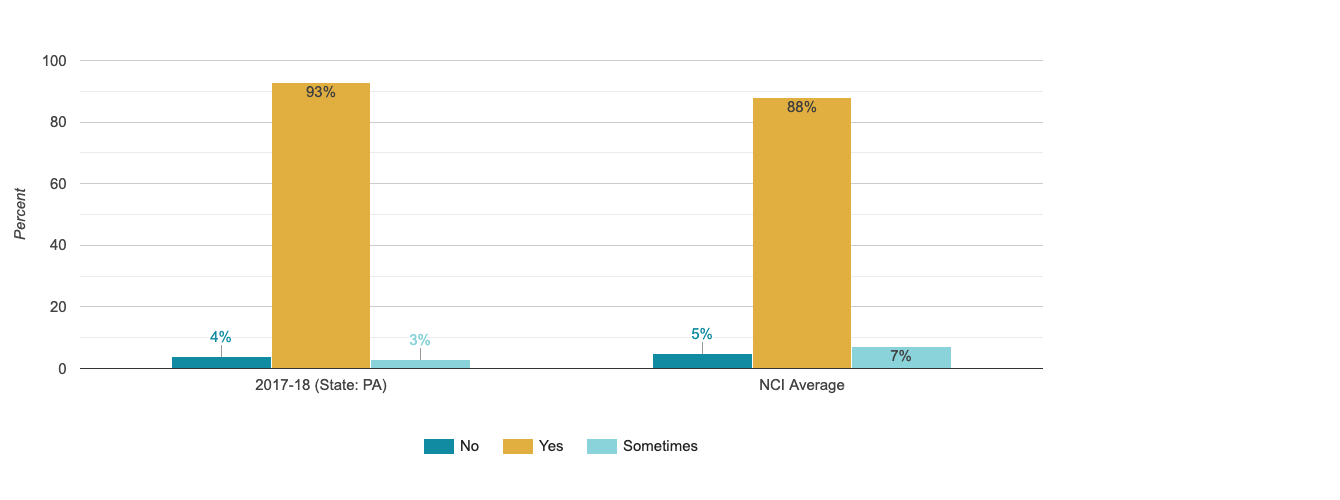
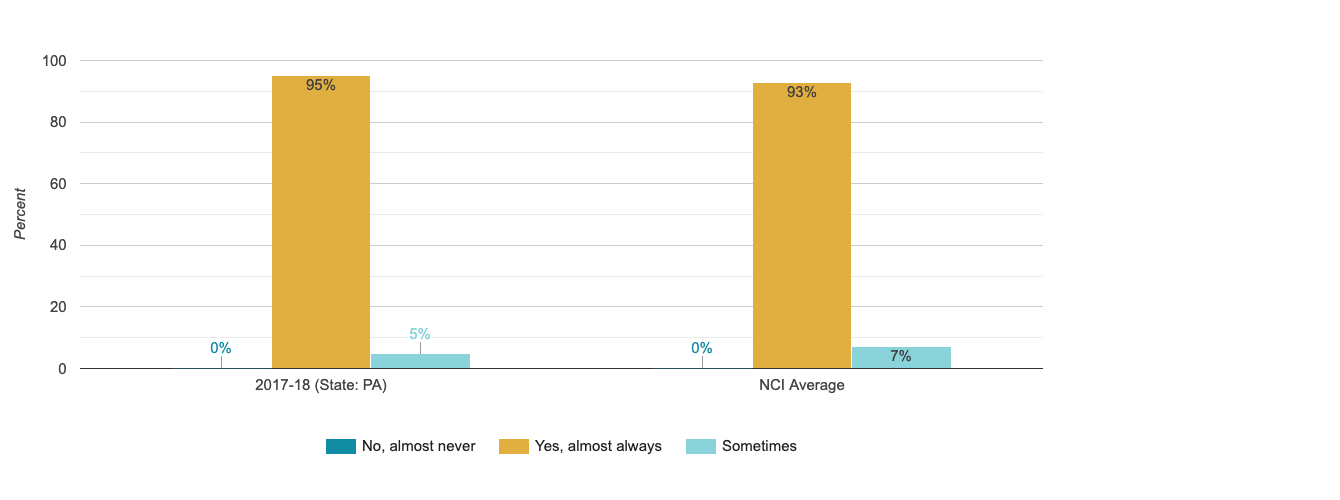
Case Manager/service Coordinator Asks What Person Wants
Percentage of people who reported their service coordinator/case manager asks them what they want
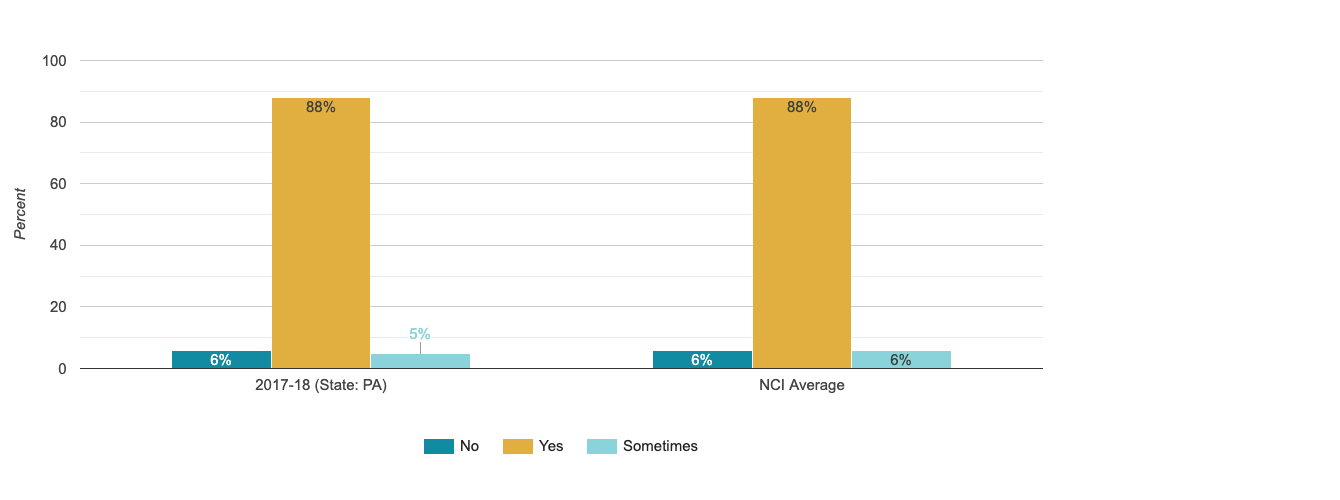
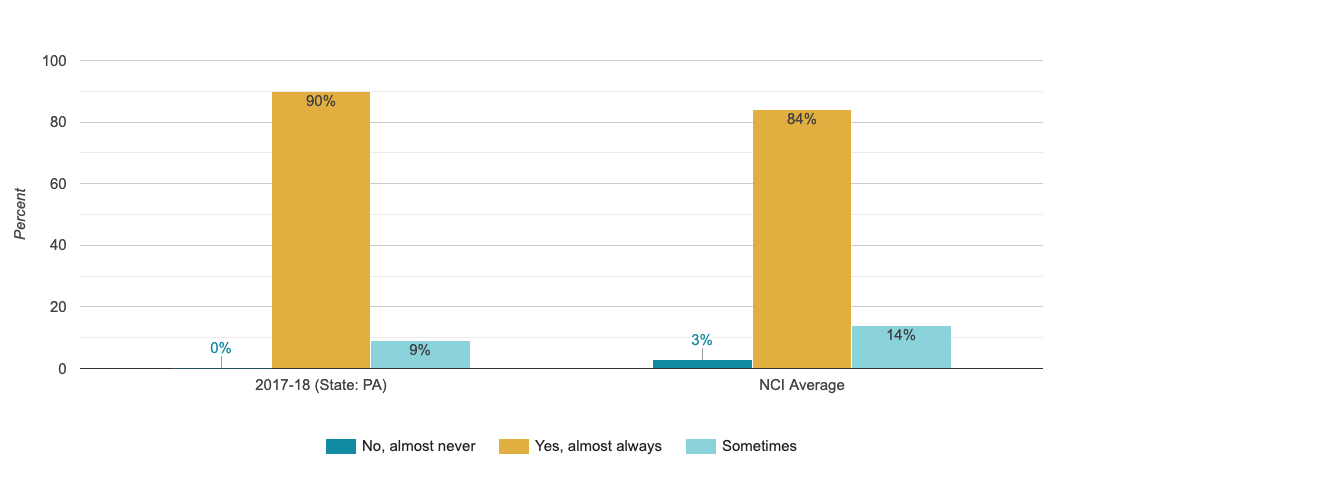
Can Contact Case Manager/service Coordinator When Wants to
Percentage of people who reported they are able to contact your case manager/service coordinator when you want to
Person Took Part in the Last Service Planning Meeting
Percentage of people who reported they took part in the last service planning meeting
Person Knew What Was Being Talked About at Last Service Plan Meeting
Percentage of people who reported that they understood what was discussed in last service planning meeting
The Service Planning Meeting Included the People That the Person Wanted to Be There
Percentage of people who reported that service planning meeting included people the person wanted to be there
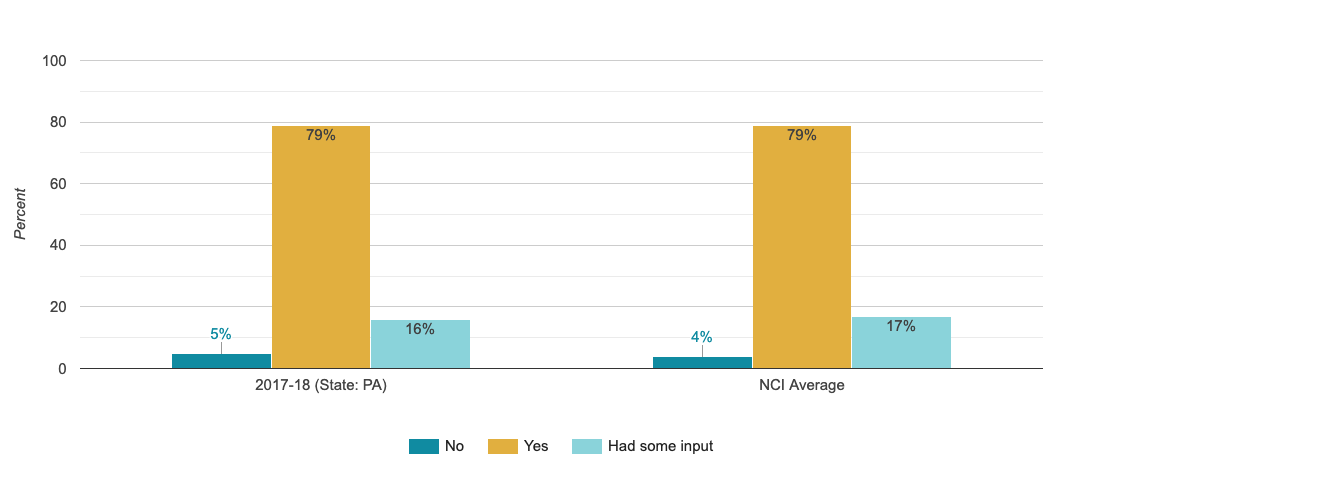
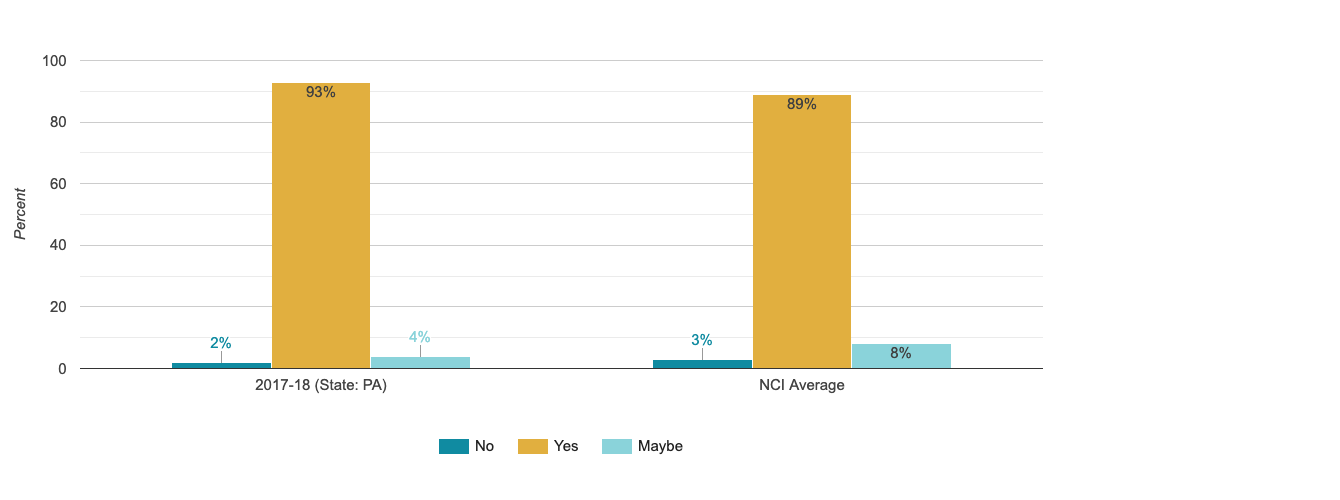
The Person Was Able to Choose the Services That Were Part of the Service Plan
The percentage of people who report having been able to choose what services were included in their service plan
Staff Come and Leave When They Are Supposed To
Percentage of people who reported support workers come and leave when they are supposed to
Access
Publicly-funded services are readily available to individuals who need and qualify for them.
Able to Get Rides for Work or Appointments
Percentage of people who reported they are always able to get rides for work or appointments
Able to Get Rides for Recreational Activities
The percentage of people who report that they have a way to get places they need to go
Staff Have Right Training to Meet Person's Needs
The percentage of people who report that they have a way to get places when they want to do something outside of the home

Additional Services Needed - Service Coordination/case Management
The percentage of people who reported needing additional services-Service coordination/case management
Additional Services Needed - Respite/family Support
The percentage of people who reported needing additional services-Respite/family support

Additional Services Needed - Transportation
The percentage of people who reported needing additional services-Transportation
Additional Services Needed - Assistance Finding, Maintaining or Changing Jobs
The percentage of people who reported needing additional services-Assistance finding, maintaining or changing jobs

Additional Services Needed - Day Services Other Than Employment
The percentage of people who reported needing additional services-Day services other than employment
Additional Services Needed - Education or Training
The percentage of people who reported needing additional services-Education or training
Additional Services Needed - Health Care Coordination
The percentage of people who reported needing additional services-Health care coordination
Additional Services Needed - Dental Care Coordination
The percentage of people who reported needing additional services-Dental care coordination
Additional Services Needed - Assistance Finding, Maintaining or Changing Housing
The percentage of people who reported needing additional services-Assistance finding, maintaining or changing housing
Additional Services Needed - Residential Support Services
The percentage of people who reported needing additional services-Residential support services
Additional Services Needed - Social/relationship Issues, Meeting People
The percentage of people who reported needing additional services-Social/relationship issues, meeting people

Additional Services Needed - Communication Technology
The percentage of people who reported needing additional services-Communication technology

Additional Services Needed - Environmental Adaptations
The percentage of people who reported needing additional services-Environmental adaptations

Additional Services Needed - Benefits/insurance Info
The percentage of people who reported needing additional services-Benefits/insurance info

Additional Services Needed - Other
The percentage of people who reported needing additional services-Other
Health
People secure needed health services.
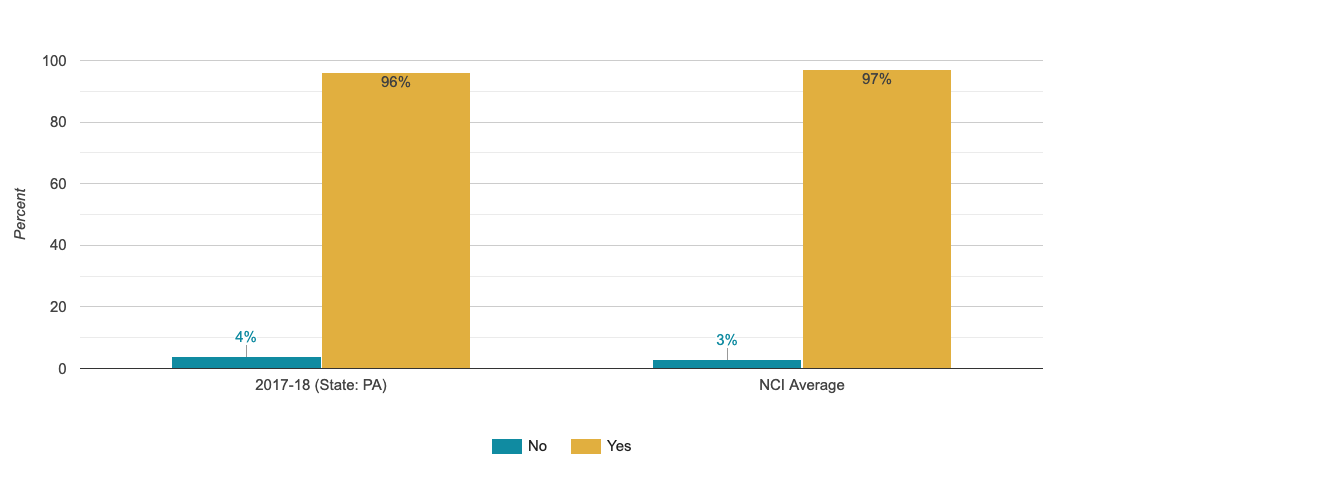
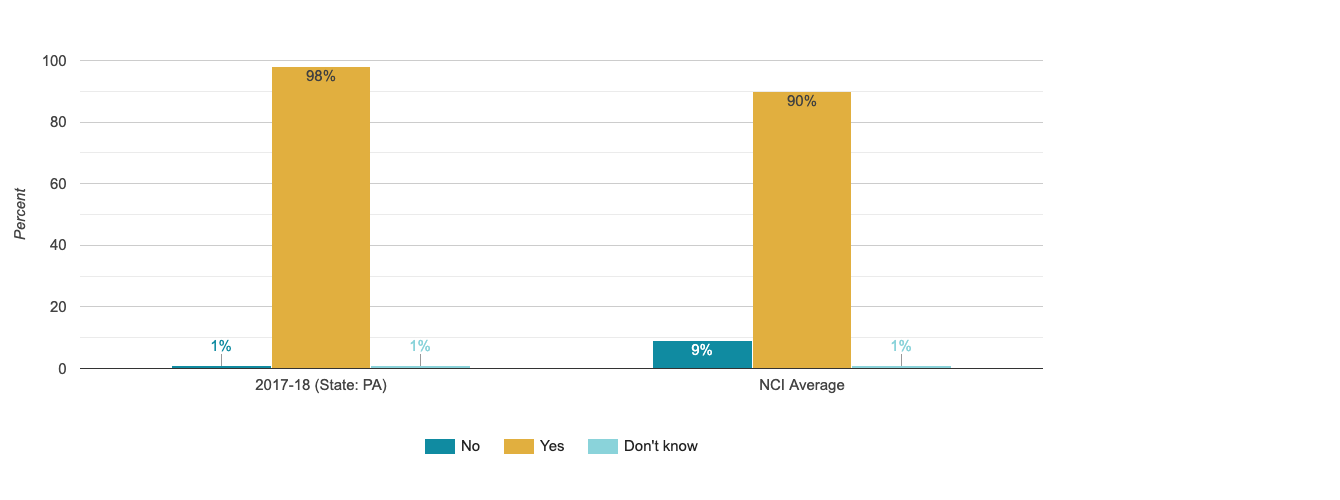
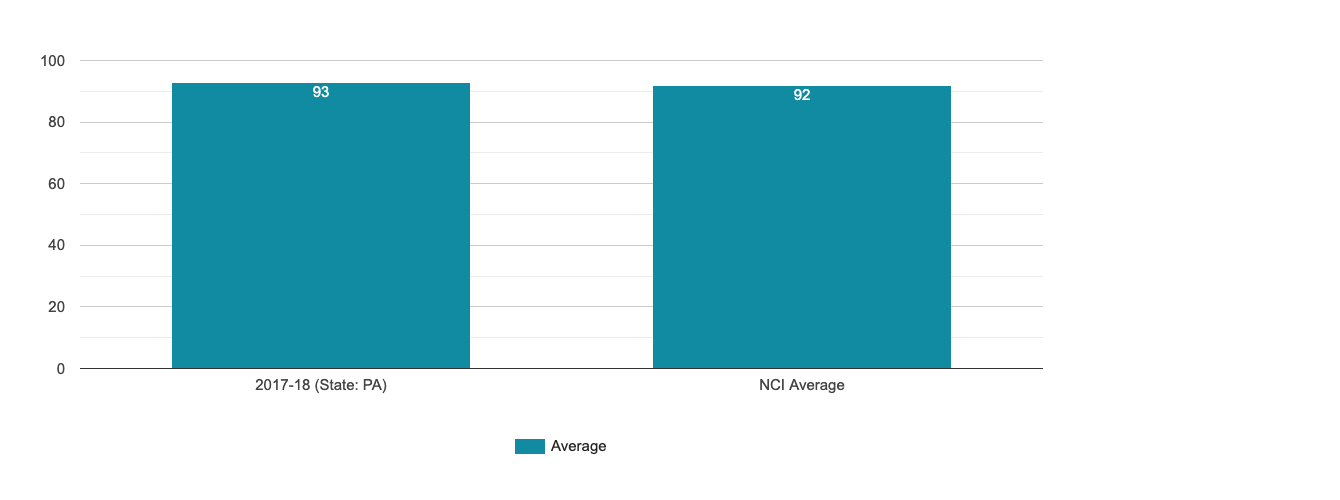
Has a Primary Care Doctor
The percentage of people who are reported to have a primary care doctor or practitioner
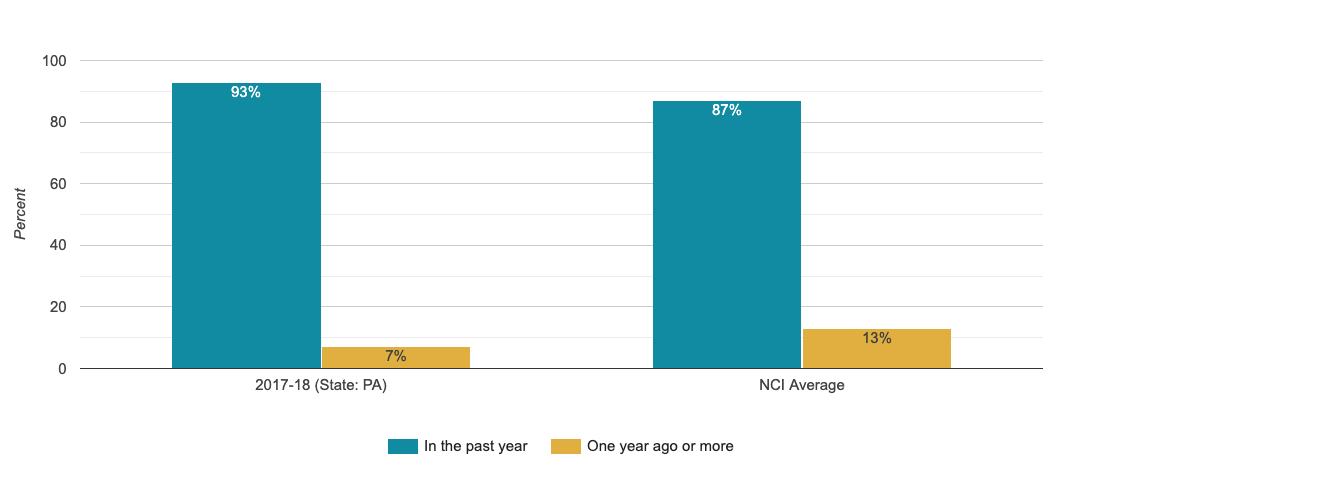
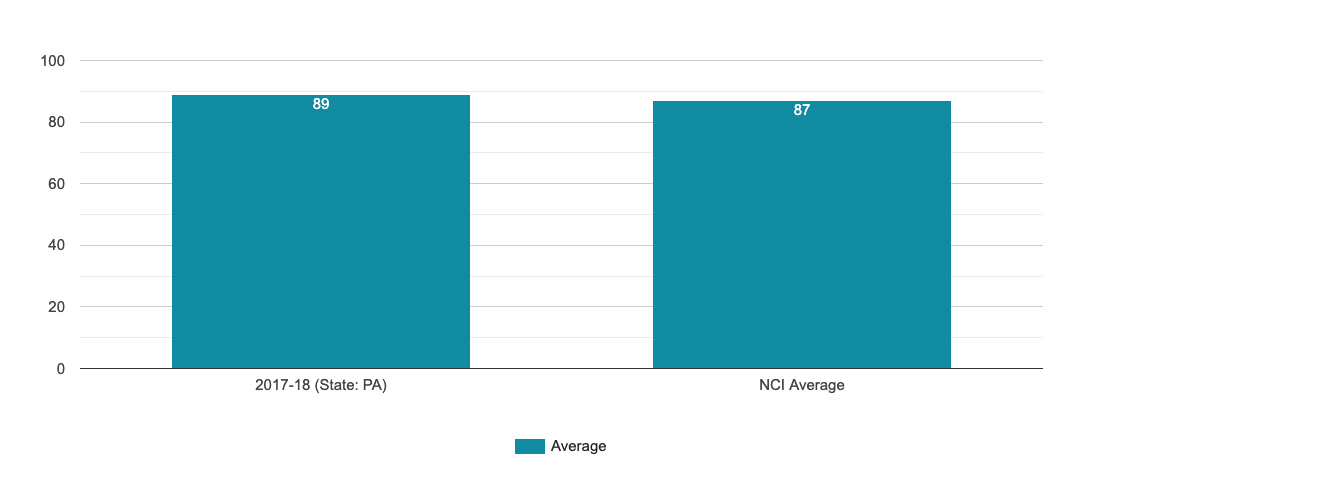
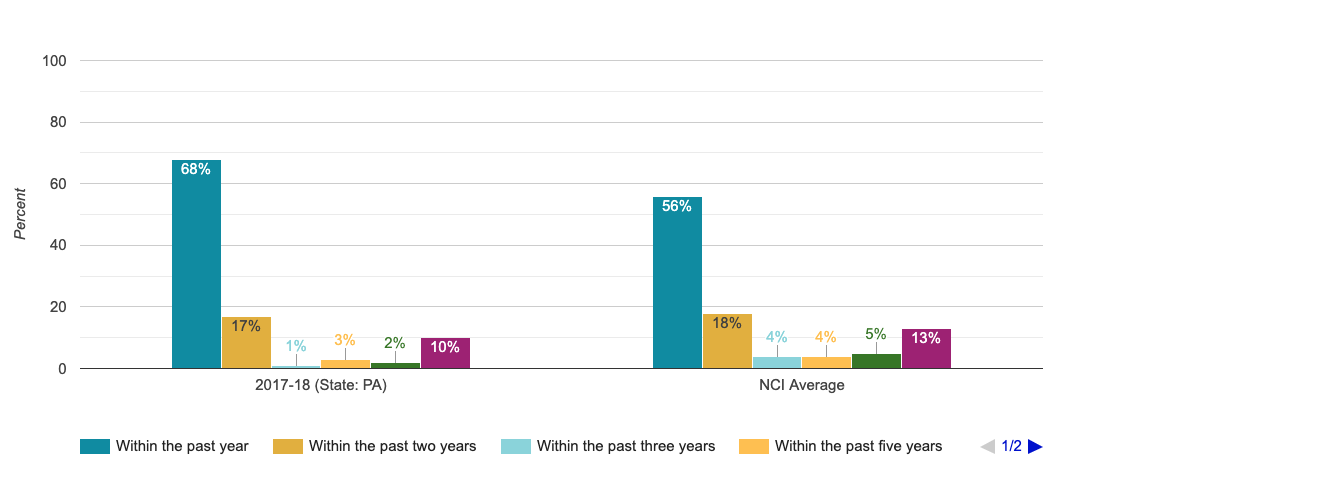
Last Physical Exam
The percentage of people who are reported have had a complete annual physical exam in the past year
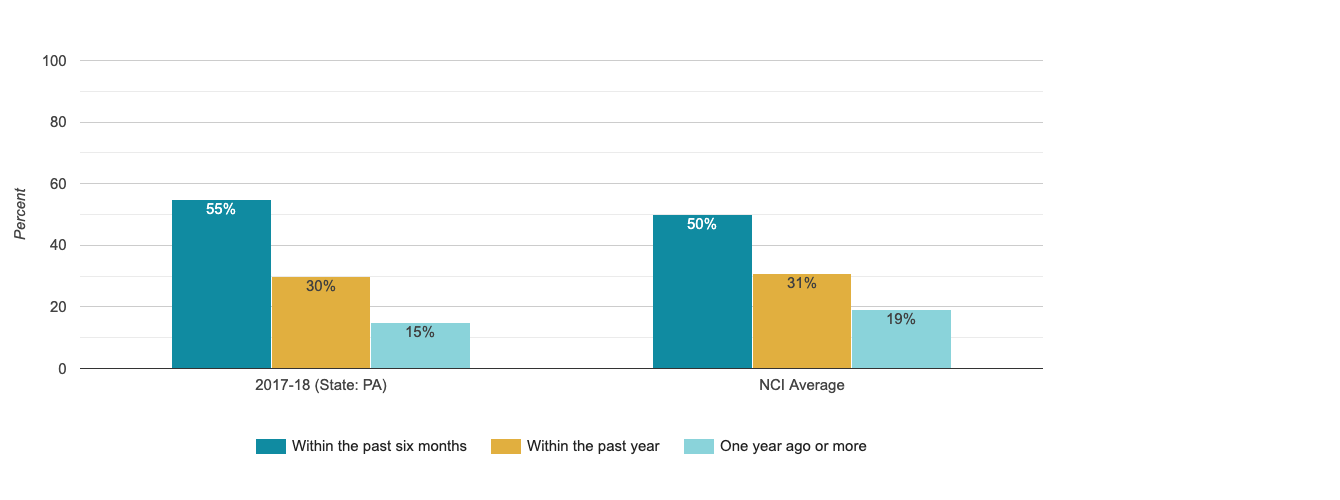
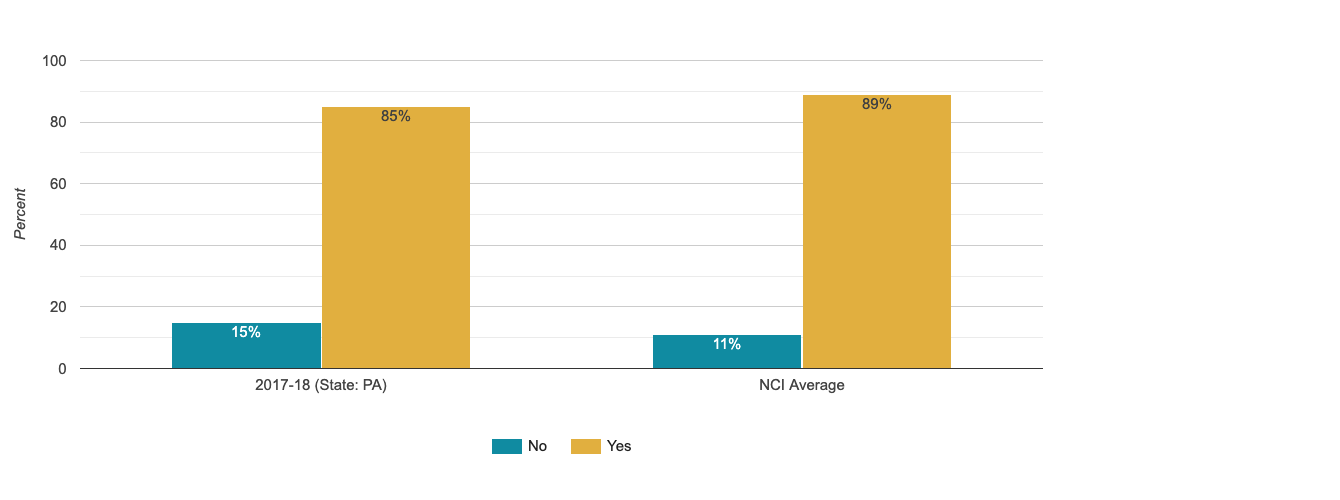
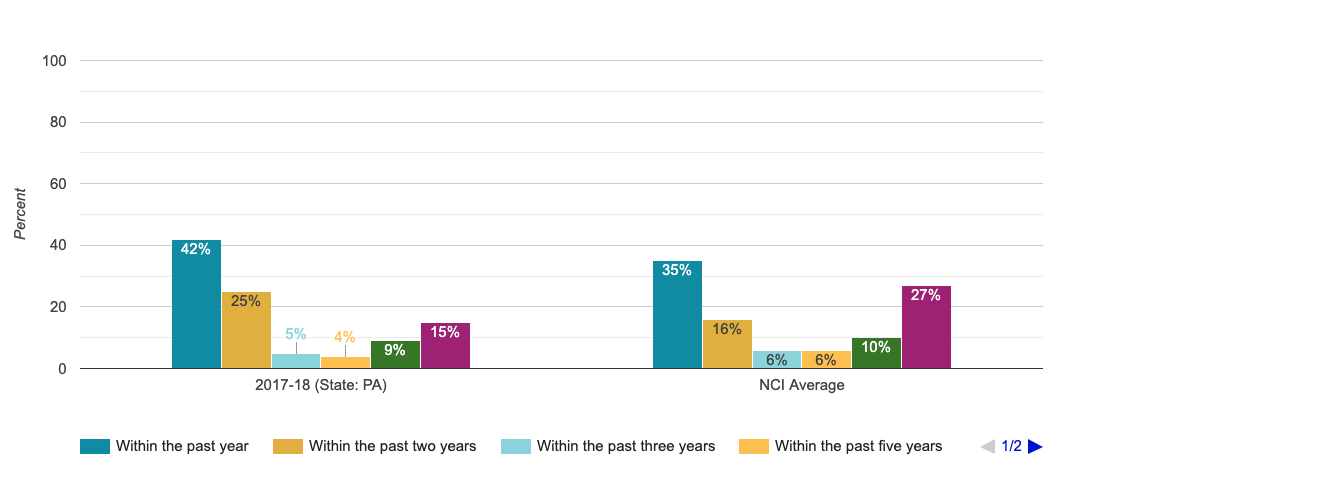
Last Dental Exam
The percentage of people who are reported to have had a routine dental exam in the past year
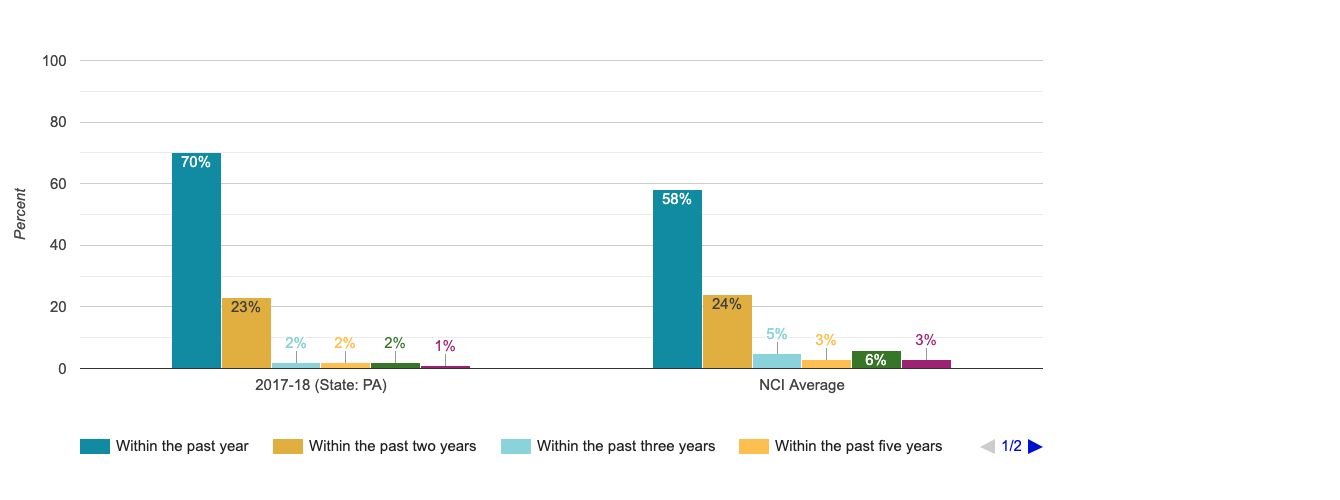
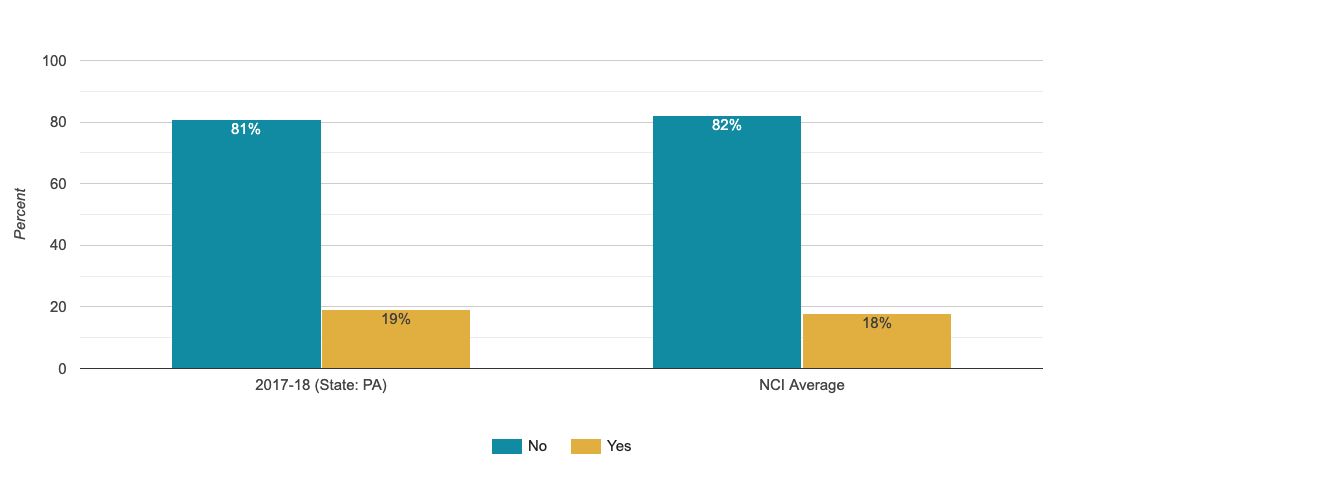
Last Eye Exam or Vision Screening
The percentage of people who are reported to have had an eye exam/vision screening within the past year
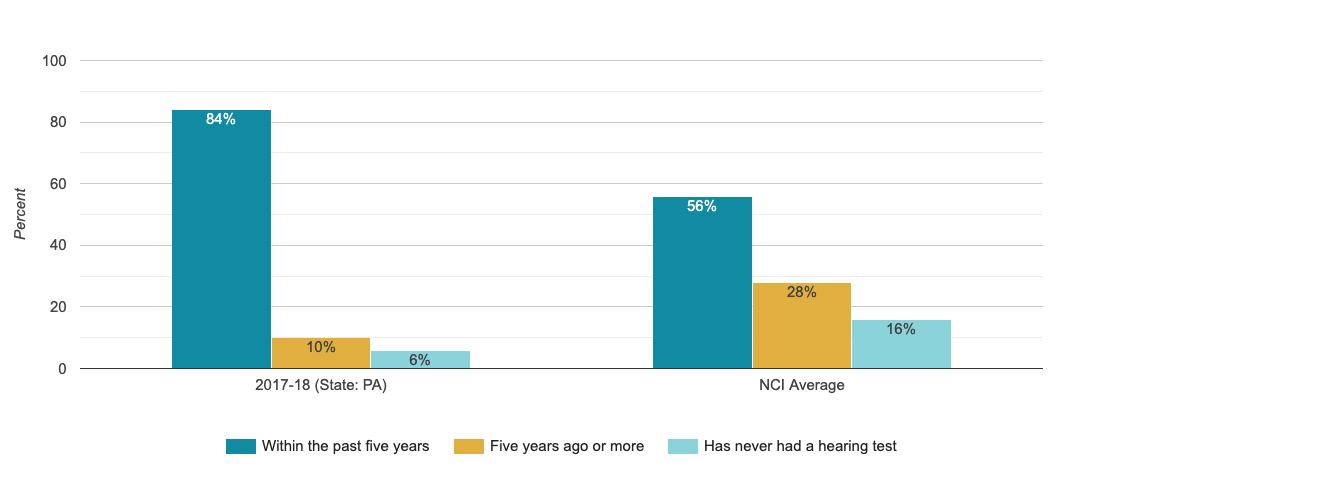
Last Hearing Test
The percentage of people who are reported to have had a hearing test within the past 5 years
Last Pap Test
The percentage of women over 21 who are reported to have had a Pap test screening at the recommended interval
Last Mammogram
The percentage of women aged 40 and older who are reported to have had a mammogram within the past 2 years
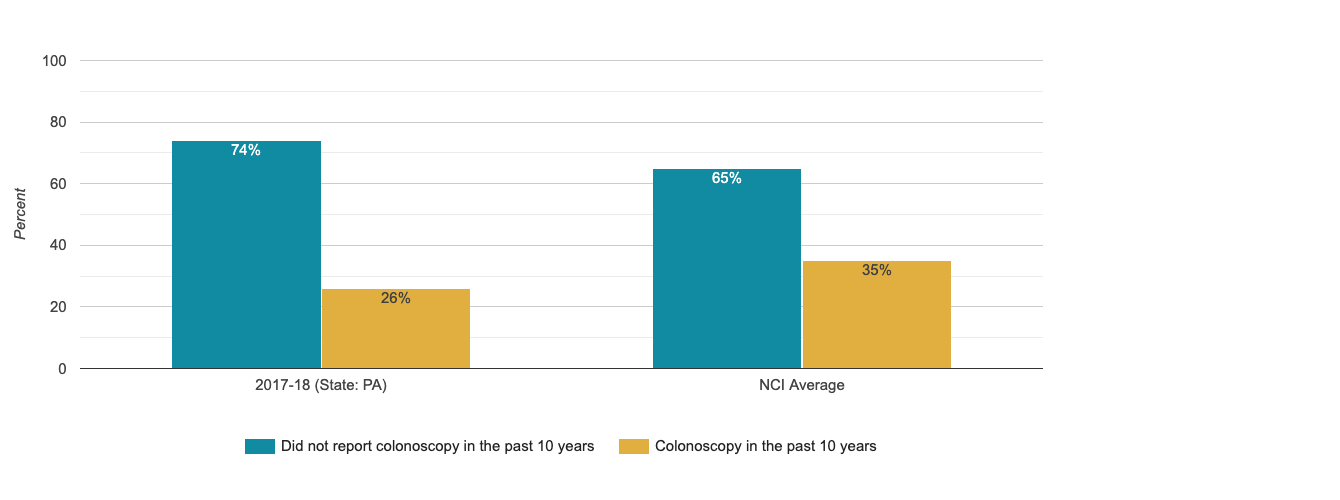
Colorectal Cancer Screening - Colonoscopy within past 10 years
The percentage of people ages 50 and over that are reported to have received colonoscopy within the past 10 years
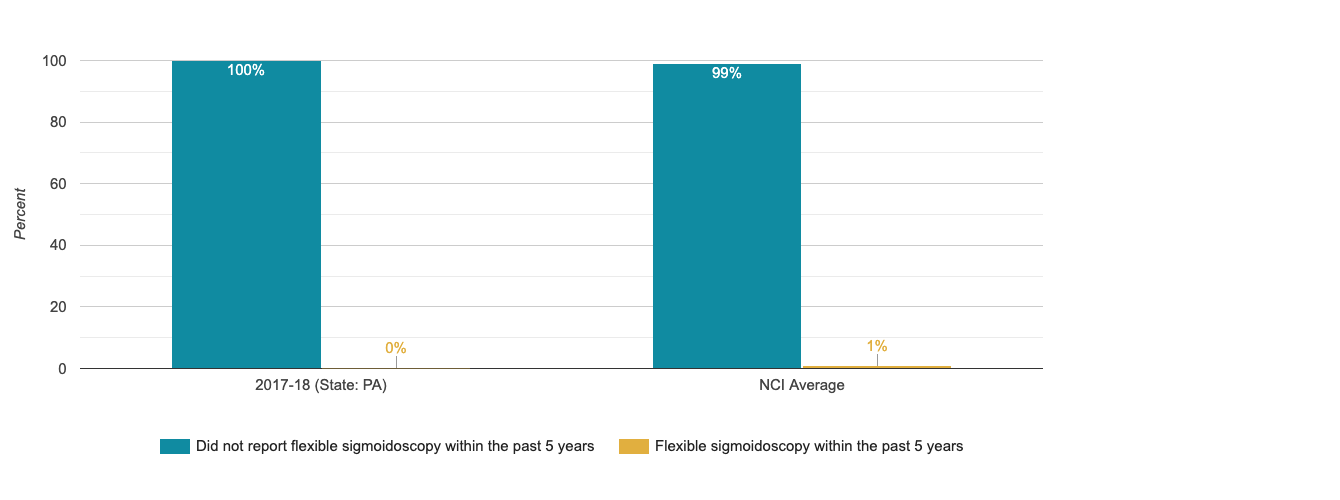
Colorectal Cancer Screening - Flexible sigmoidoscopy within past 5 years
The percentage of people ages 50 and over that are reported to have received flexible sigmoidoscopy within the past 5 years
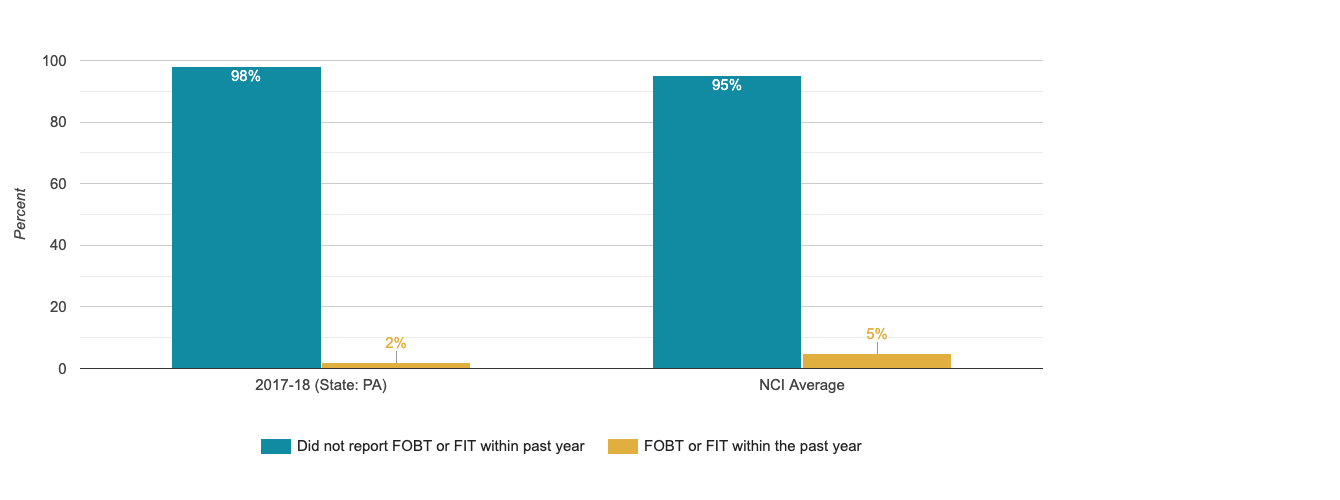
Colorectal Cancer Screening - FOBT or FIT within past year
The percentage of people ages 50 and over that are reported to have received Fecal Occult Blood Test (FOBT) or Fecal Immunochemical Test (FIT) in the past year
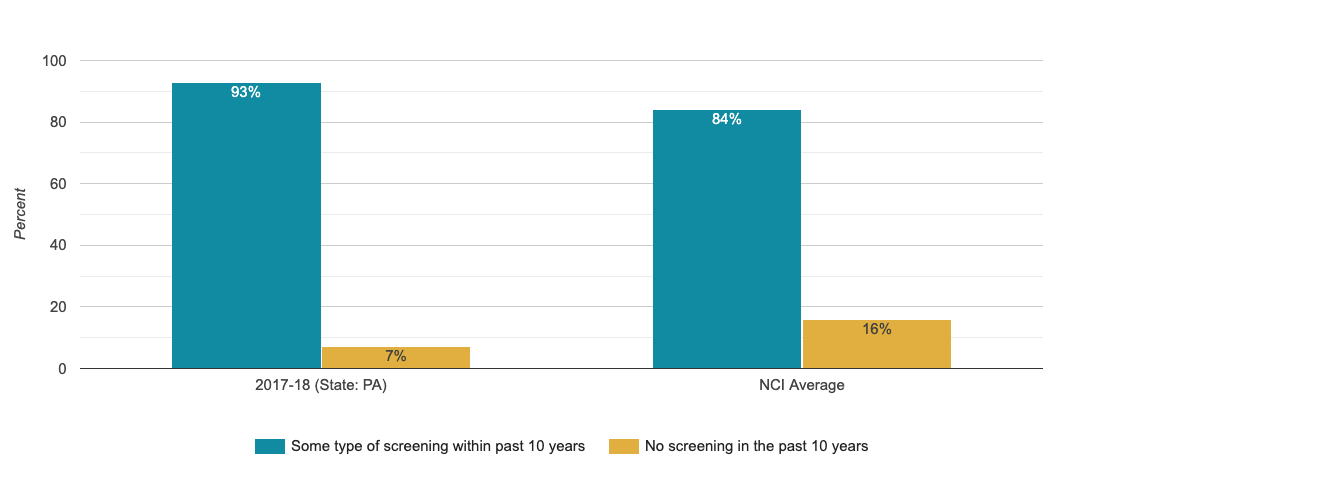
Colorectal Cancer Screening - Did not have screening past 10 years
The percentage of people ages 50 and over that are reported to have not had screening for colorectal cancer within the past 10 years
Had a Flu Vaccine in the Past Year
The percentage of people who are reported to have had a flu vaccination within the past 12 months
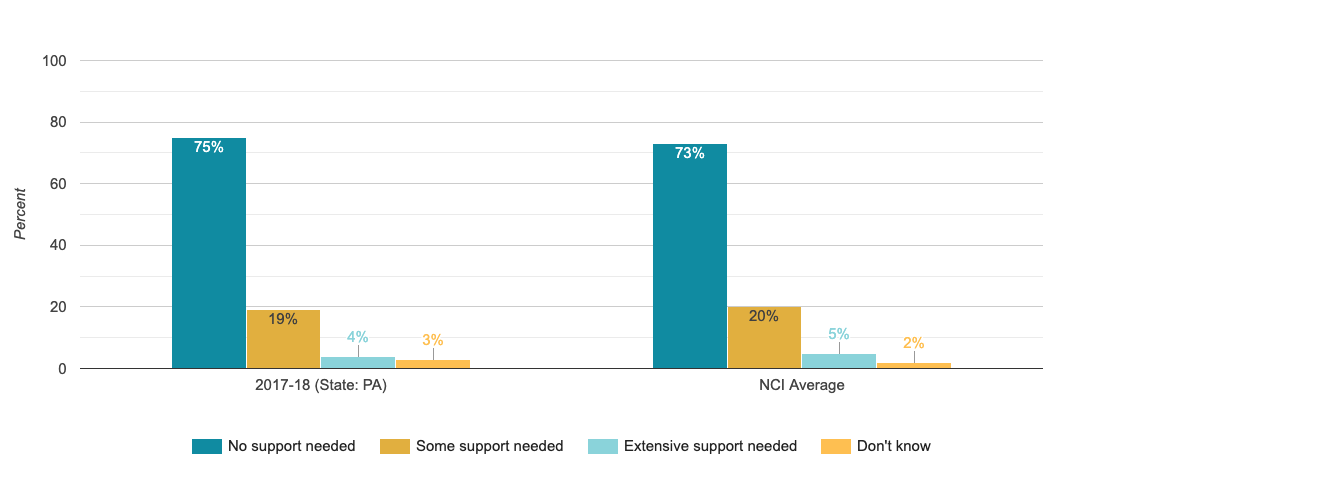
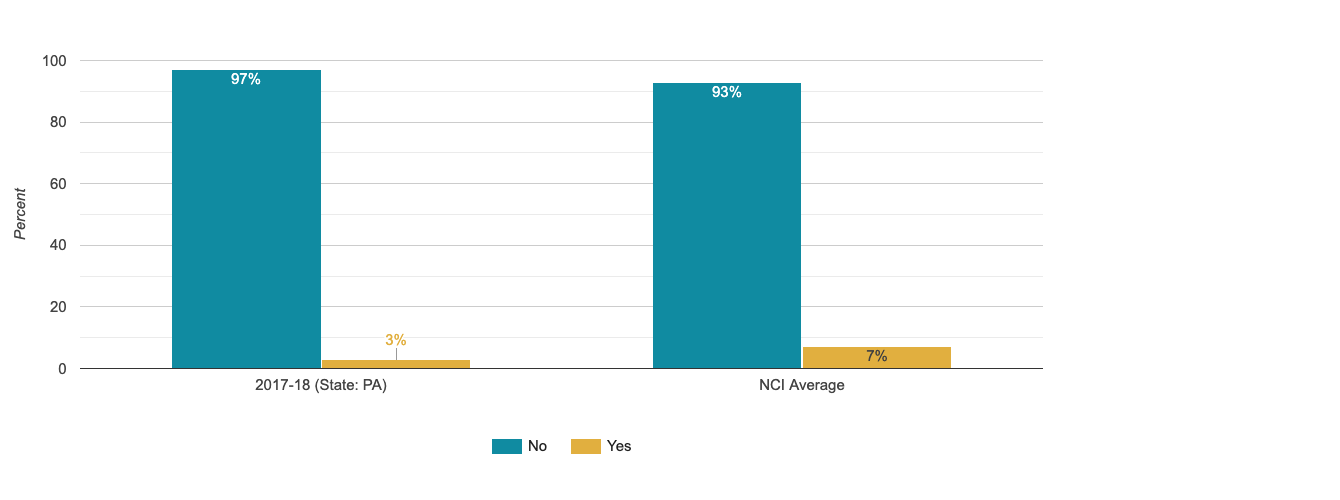
Medications
Medications are managed effectively and appropriately.
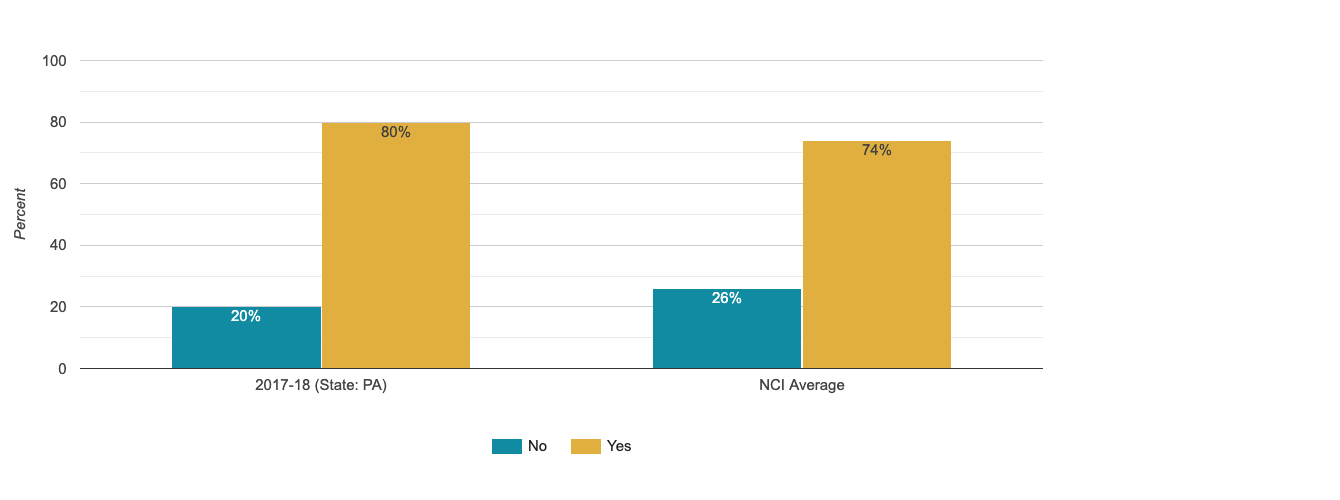
Takes at Least One Medication for Mood, Anxiety, Psychotic Disorder And/or Behavioral Challenges
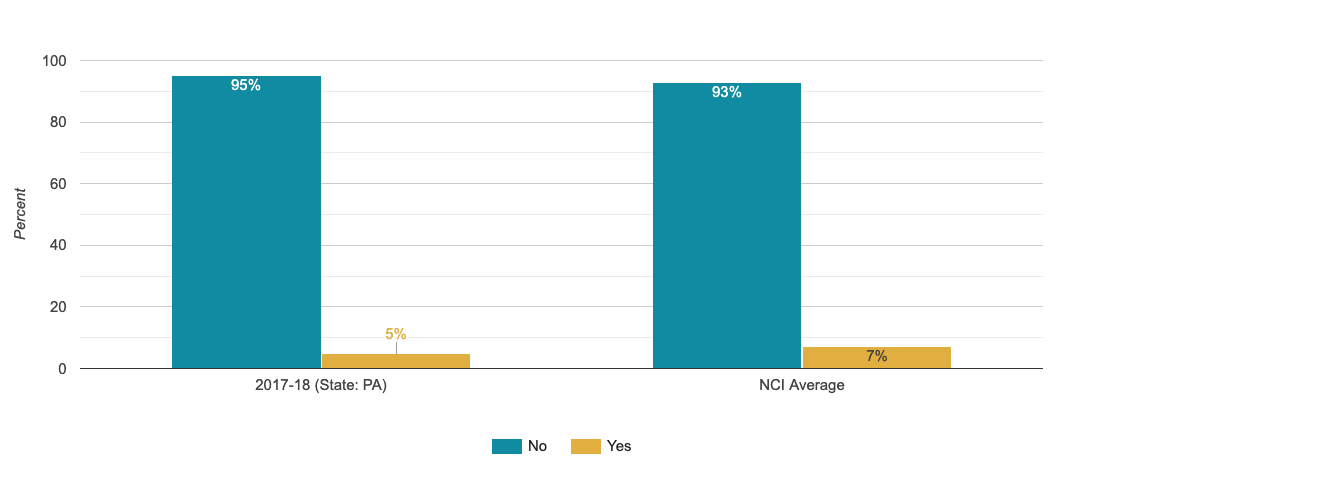
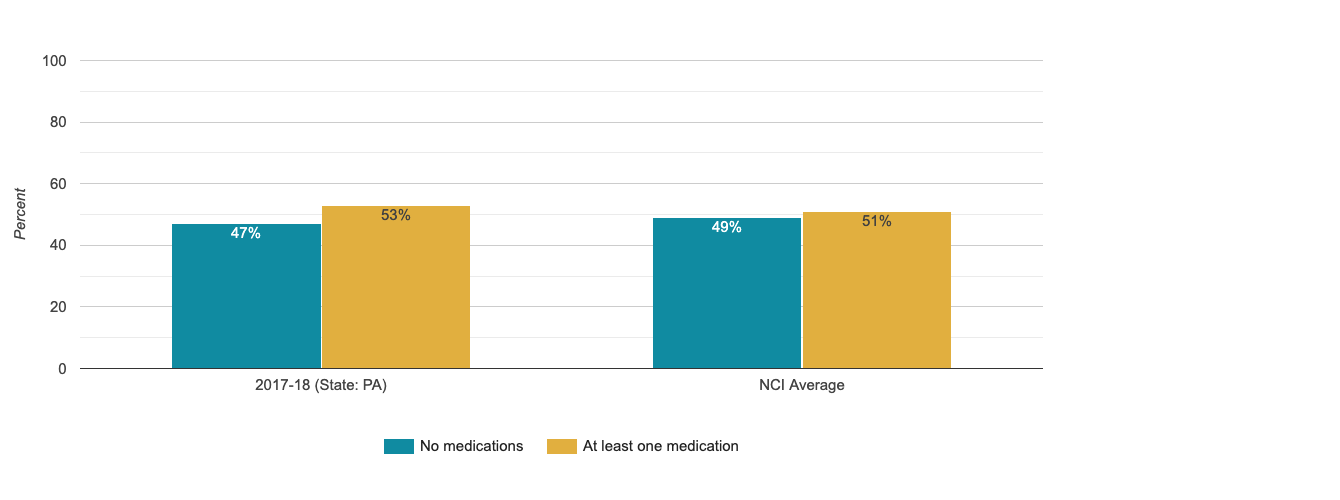
Takes Medication for Mood, Anxiety, And/or Psychotic Disorders
The percentage of people reported to be taking medications for mood, anxiety, and/or psychotic disorders
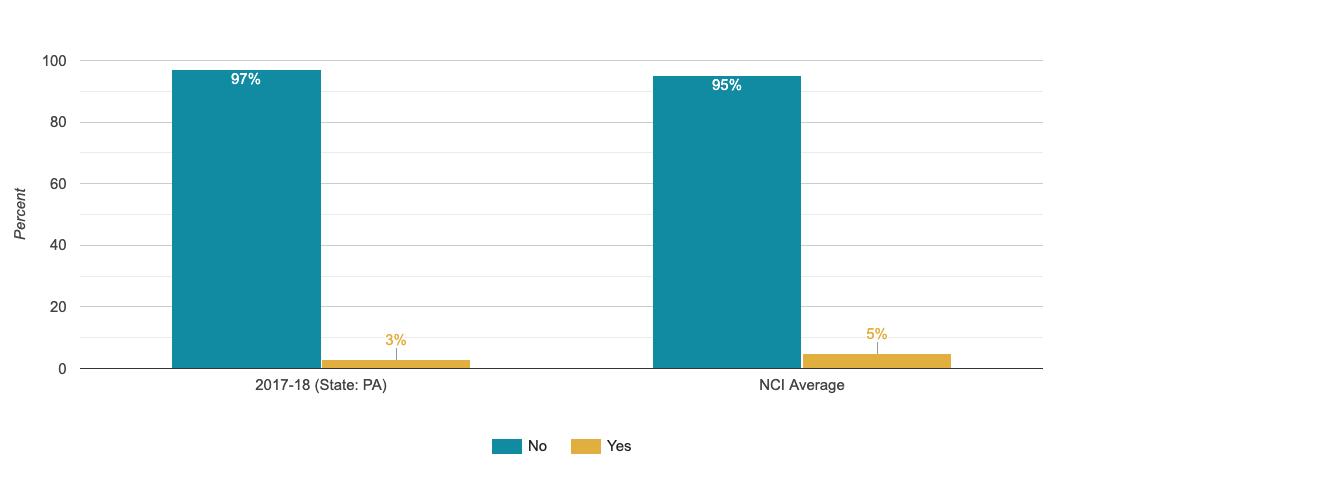
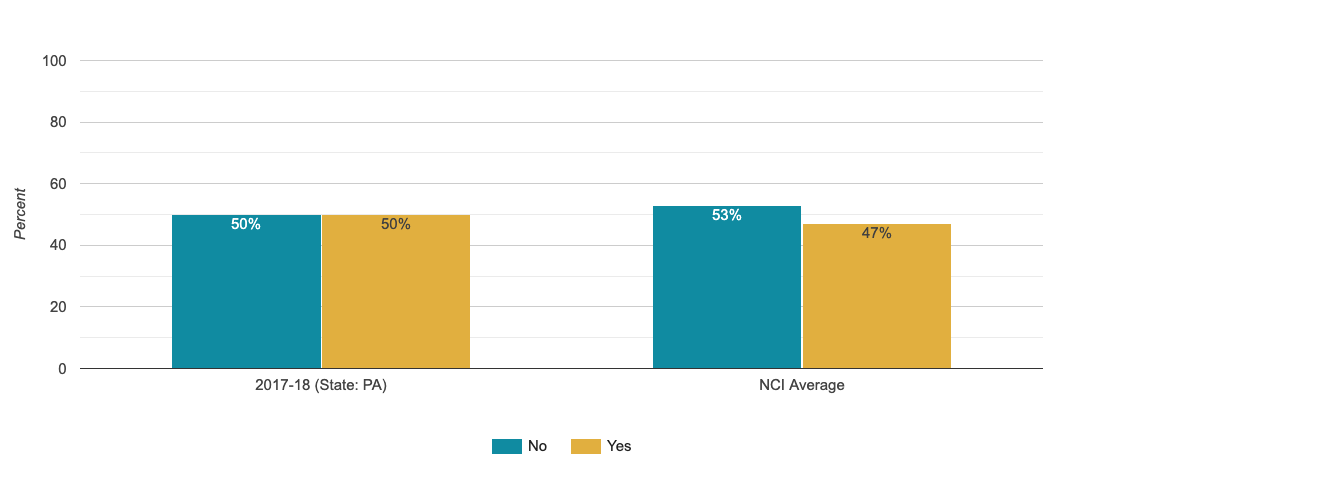
Takes at Least One Medication for Behavior Challenges
The percentage of people reported to be taking medications for behavior challenges
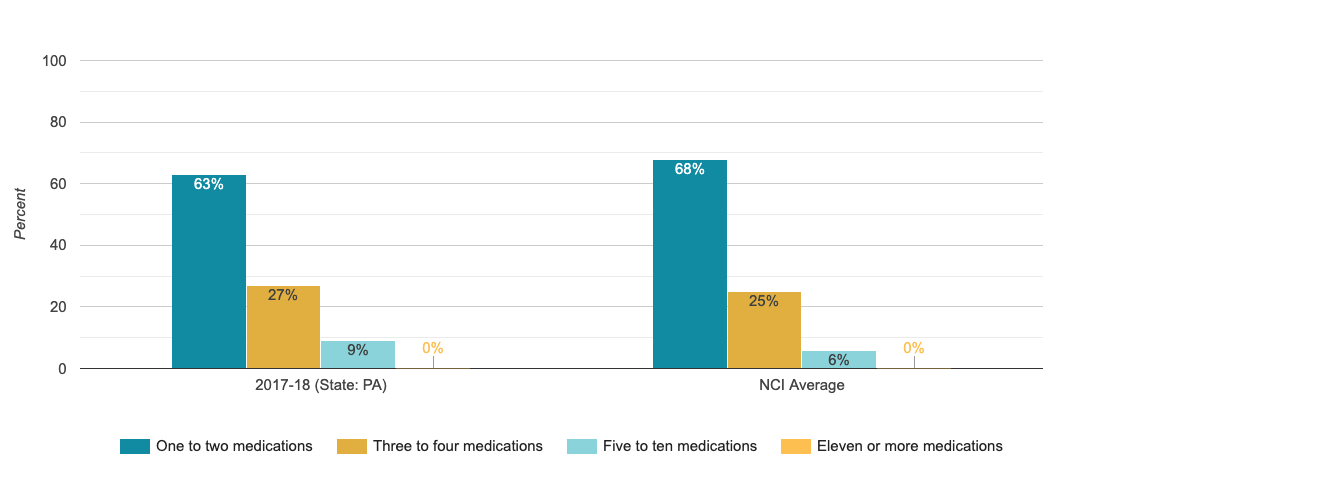
Number of Medications Taken for Mood Disorders, Anxiety And/or Psychotic Disorders
Number of medicationss taken for at least one of the following: mood disorders, anxiety, psychotic disorders
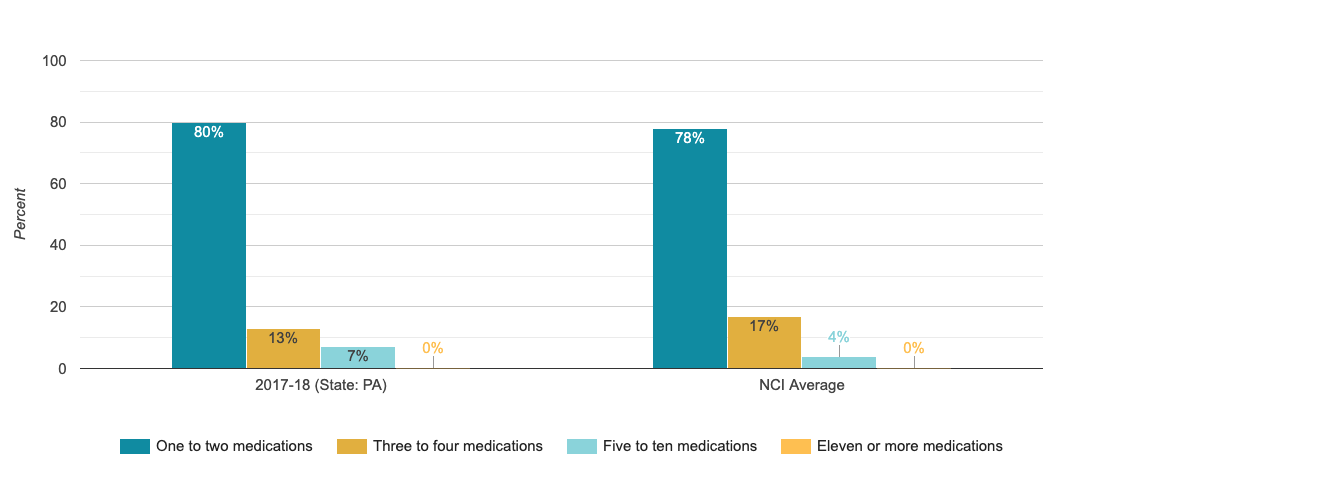
Number of Medications Taken for Behavioral Challenges
Number of medications taken for behavior challenges
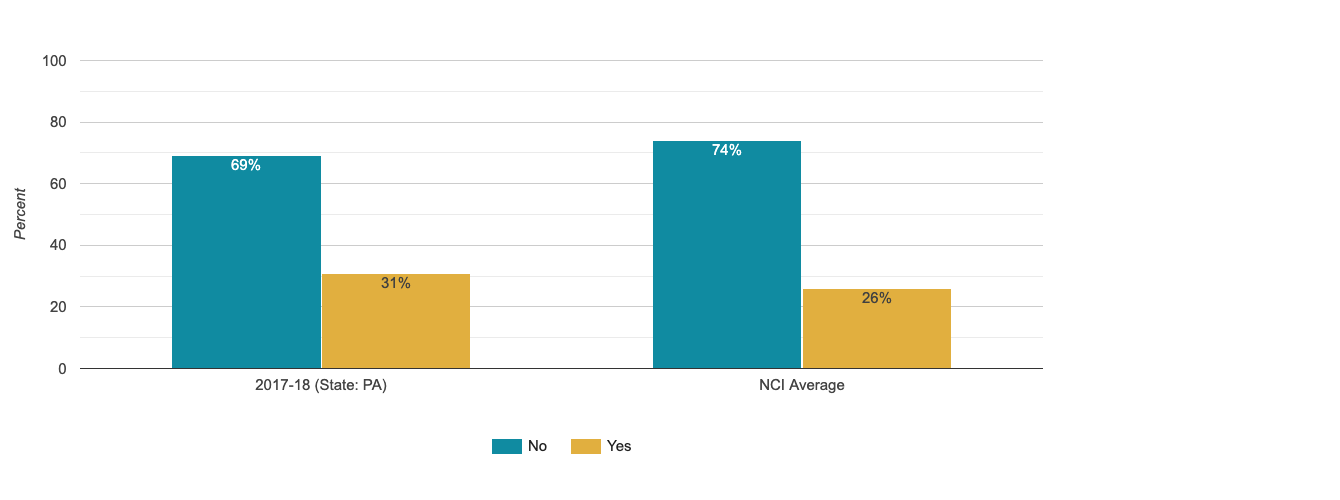
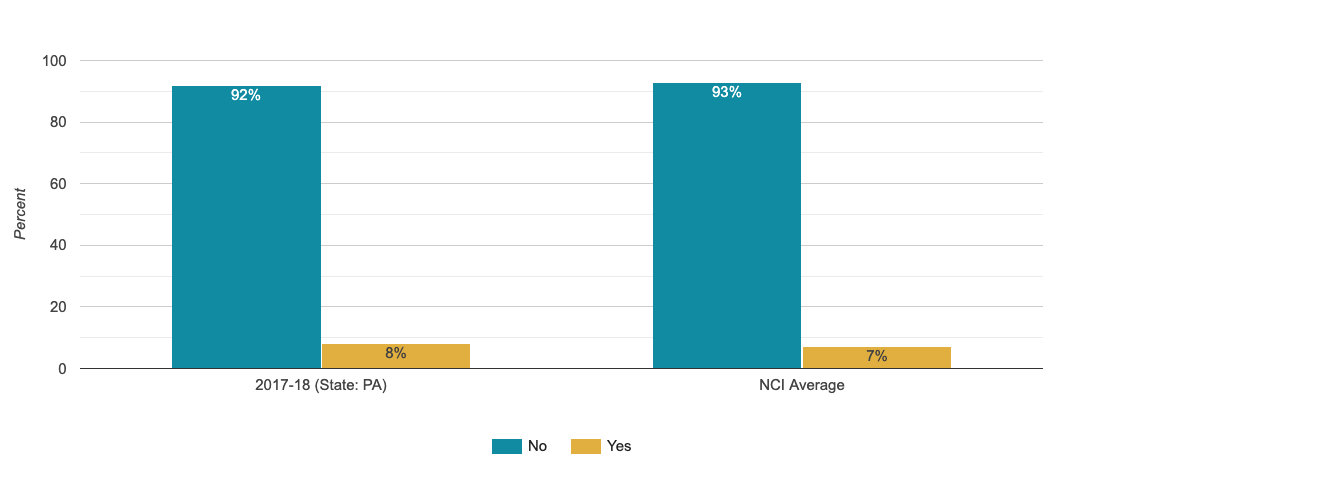
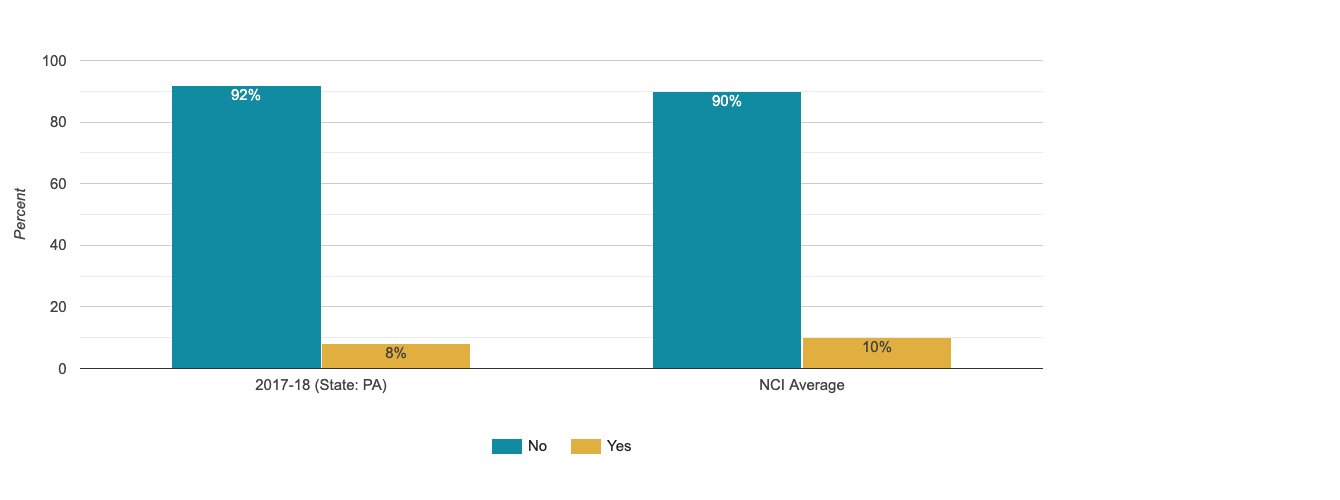
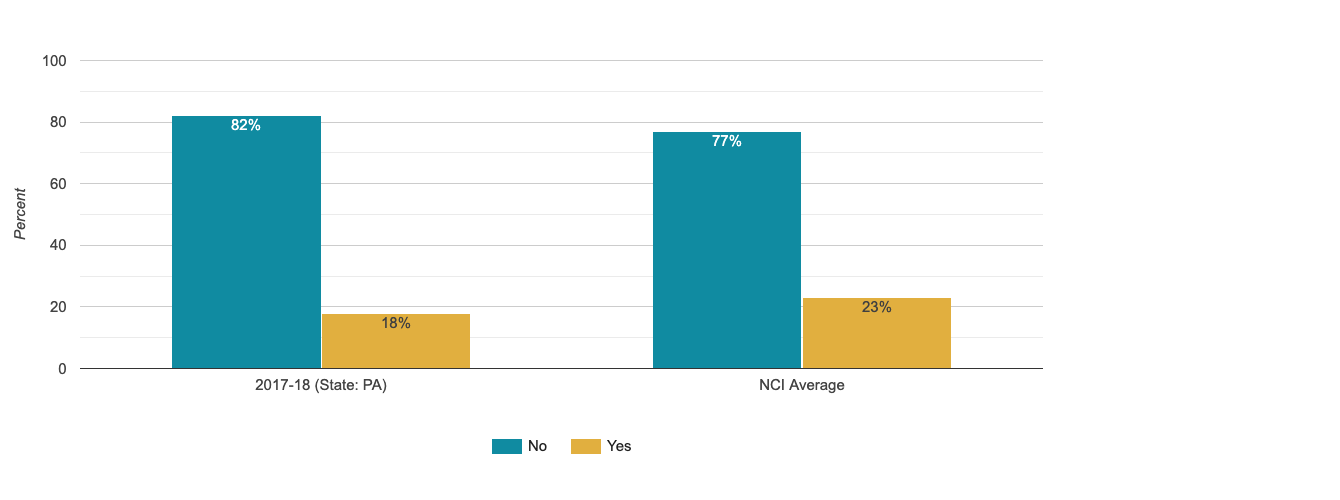
Has a Behavior Plan
Percentage of people reported to have a behavior plan
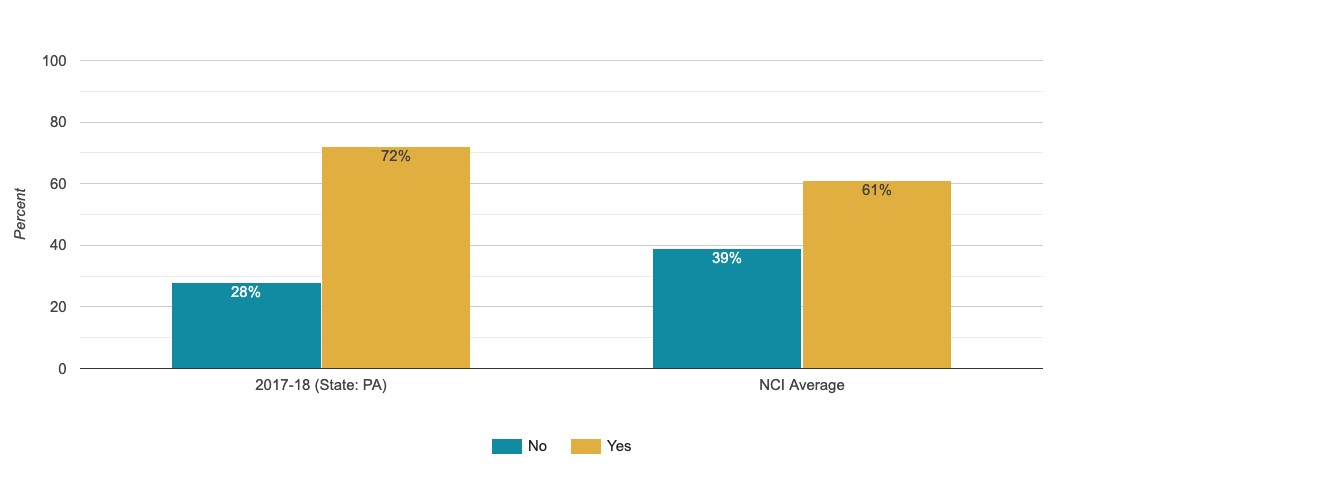
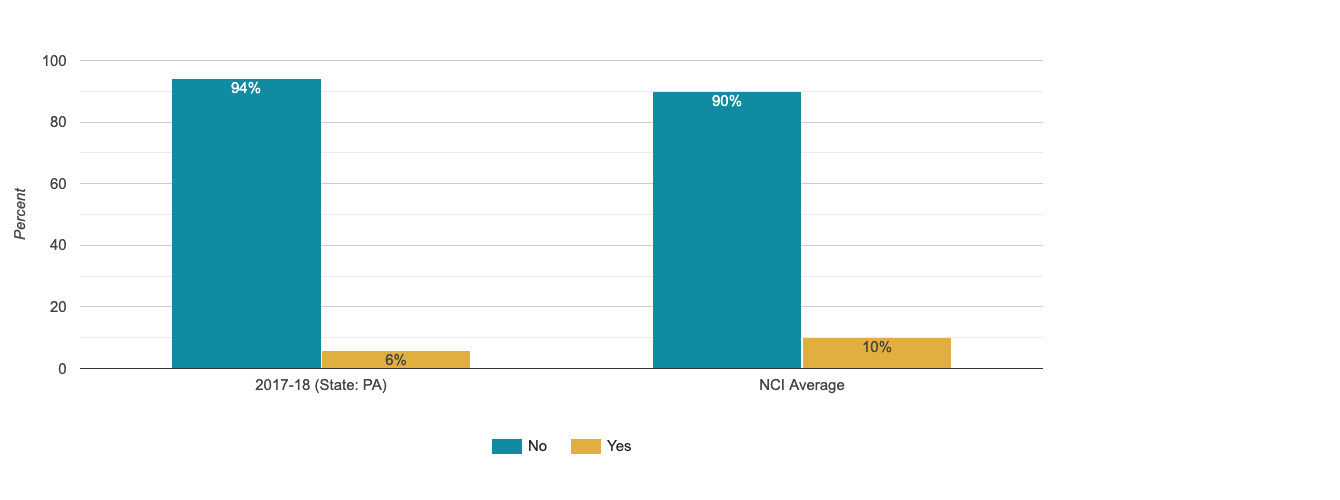
Has a Behavior Plan If Taking Medications for Behavior Challenges
The percentage of people who are reported to take medications for behavior challenges and are reported to have a behavior plan
Wellness
People are supported to maintain healthy habits.
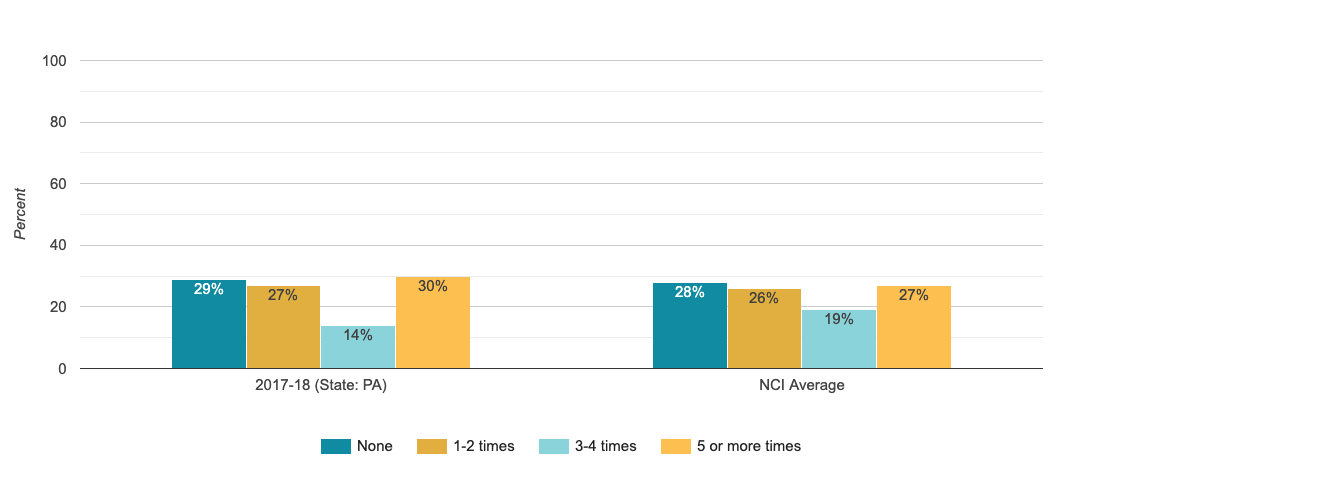
Moderate Physical Activity
The percentage of people who report engaging in regular moderate physical activity (at least once per week for 10 minutes or more at a time)
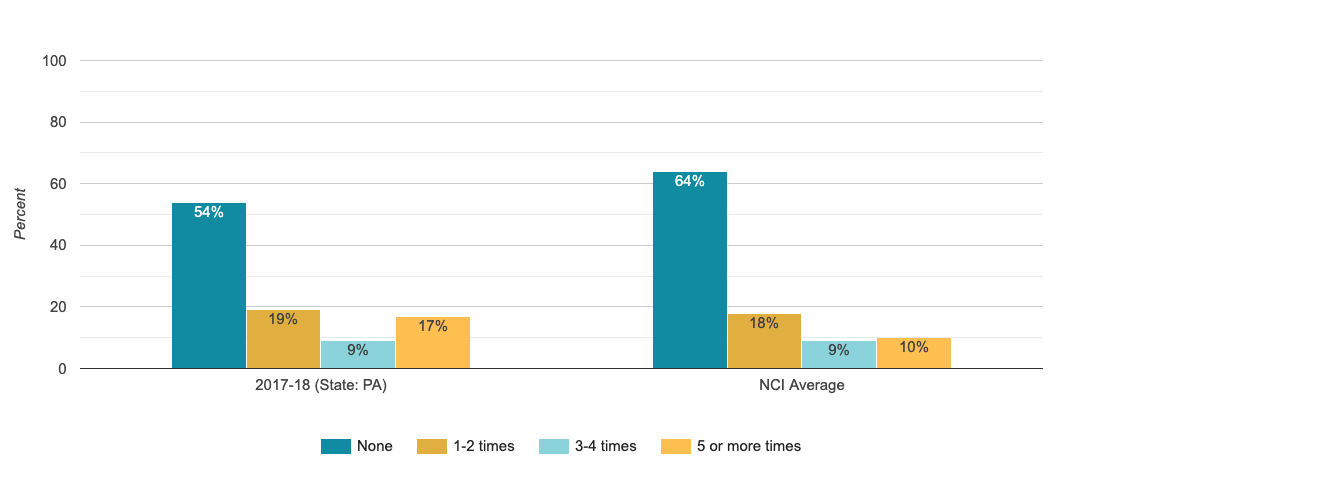
Strength Exercises
The percentage of people who report engaging in regular physical activity that makes the muscles in arms, legs, back, and/or chest work hard
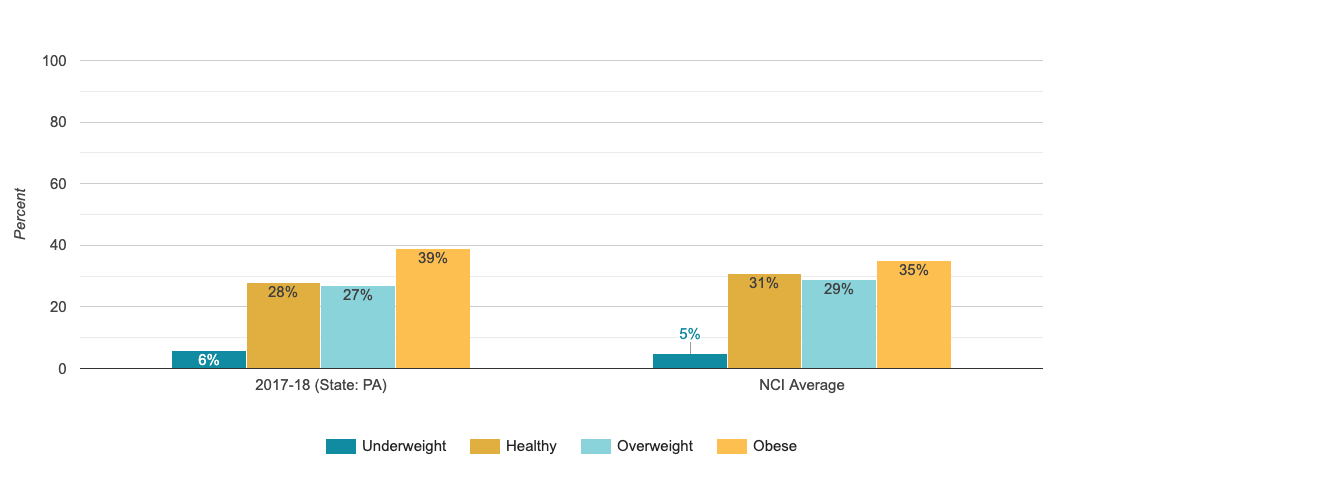
Bmi/body Mass Index
Percentage of people in each BMI category

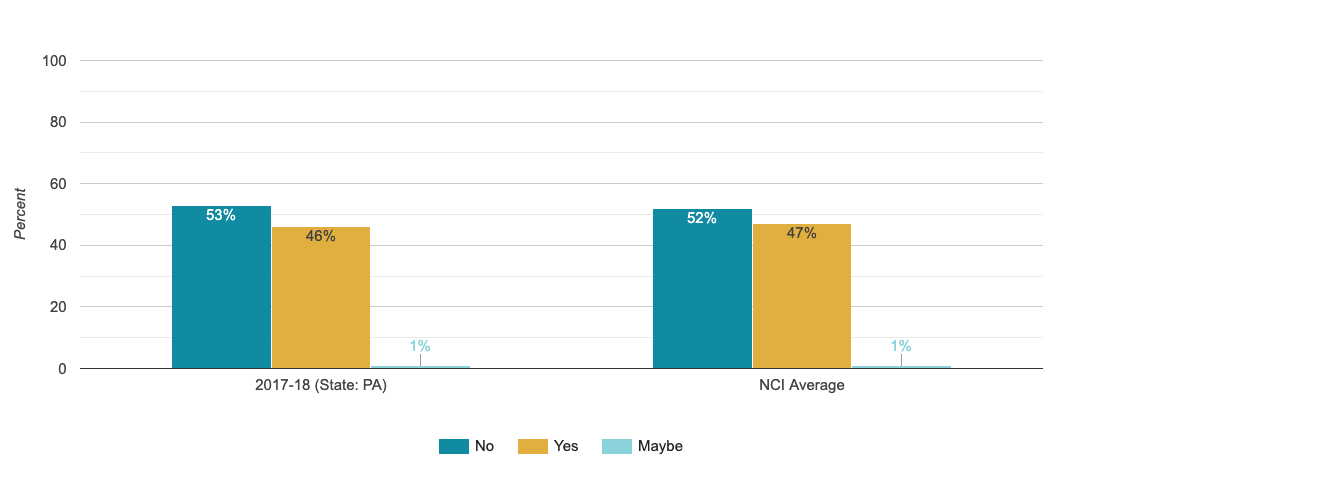
Use Nicotine or Tobacco Products
The percentage of people who were reported to use nicotine or tobacco products
Respect/Rights
People receive the same respect and protections as others in the community.
Has a Key to the Home
Percentage of people who report having a key to their home
People Always Ask Before Entering Home
The percentage of people who report that others (who do not live in the home) let them know when entering home
Can Lock Bedroom If Wanted
Percentage of people who report they can lock their bedroom
People Always Ask Before Entering Bedroom
The percentage of people who report that others let them know when entering their bedroom

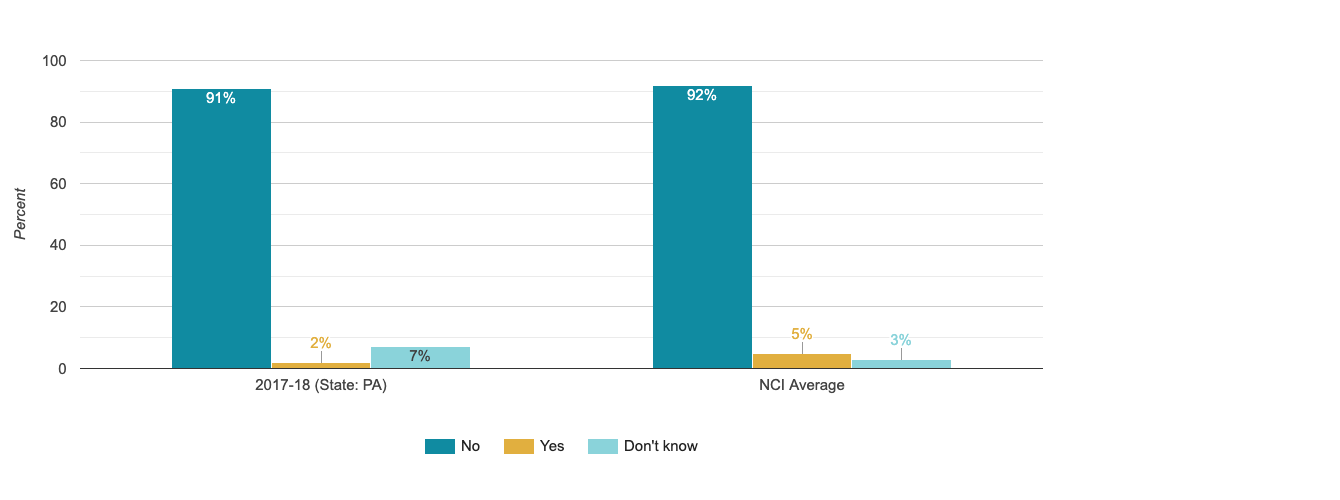
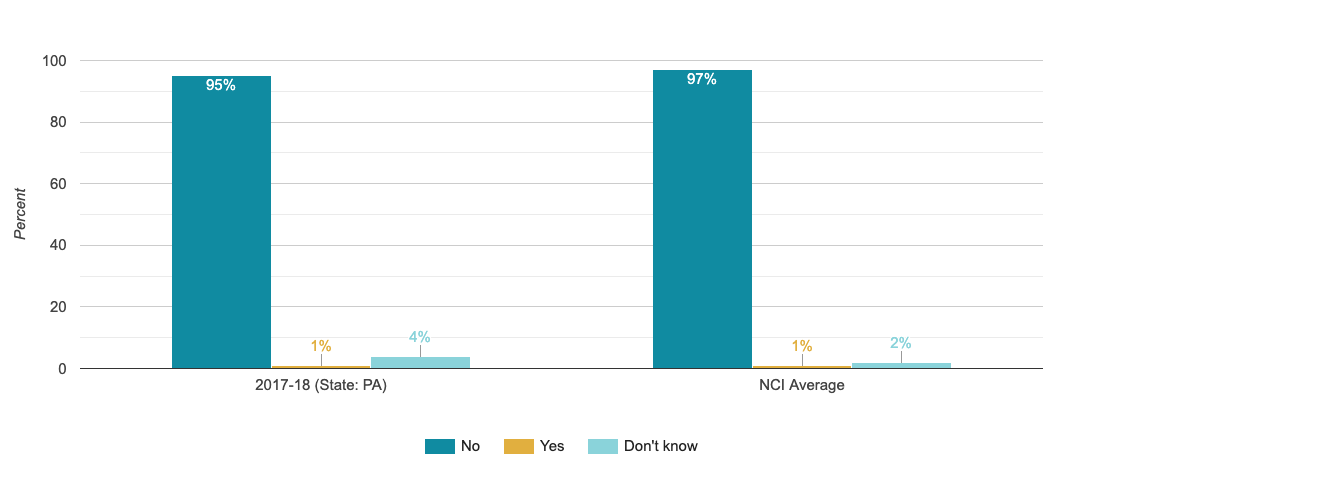
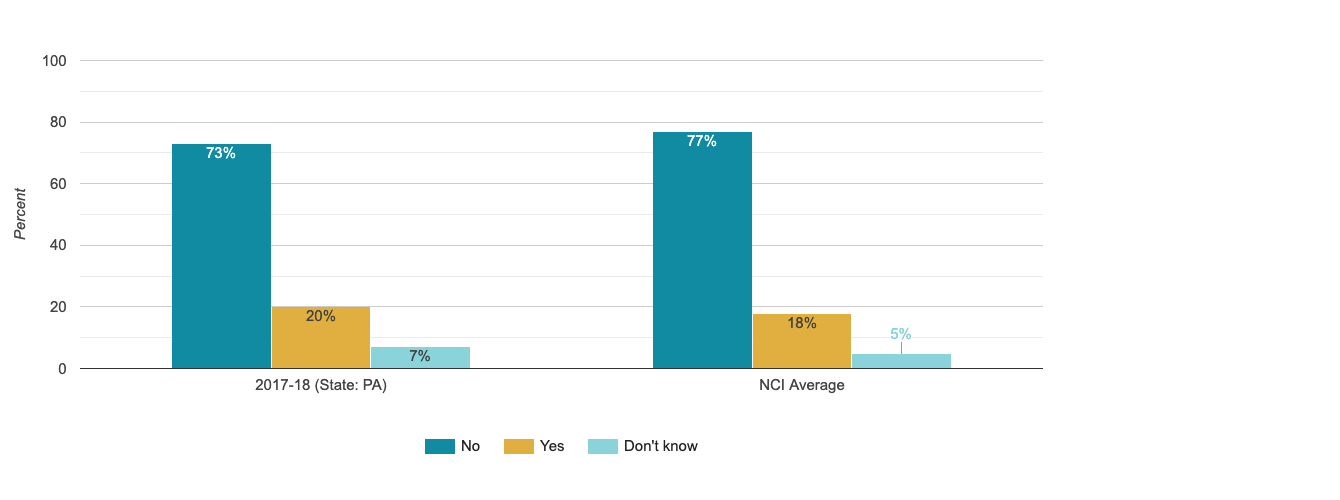
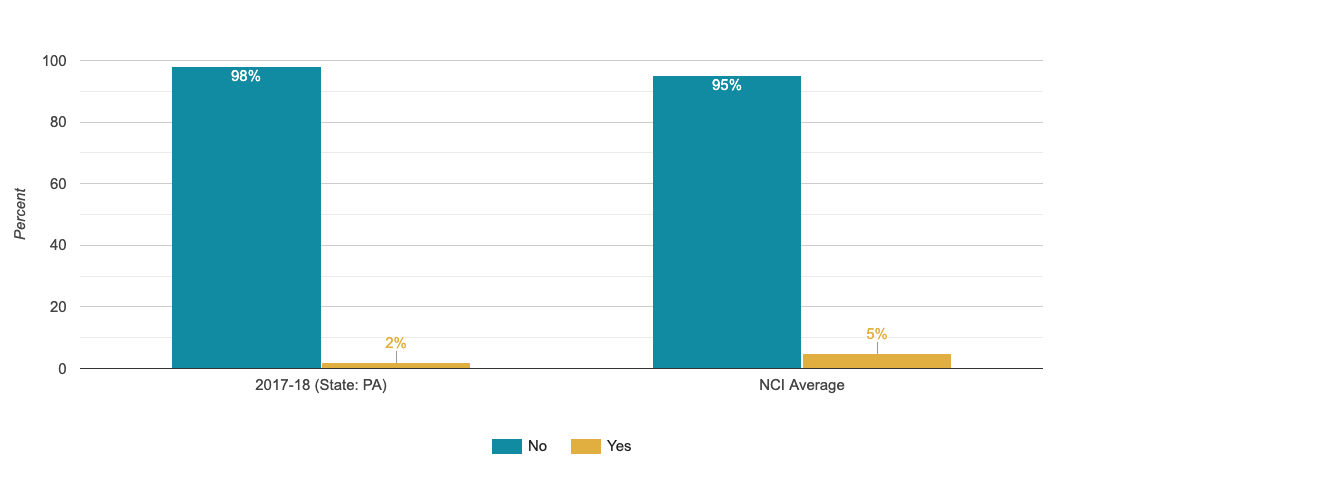
Mail or Email Is Read Without Permission
The percentage of people who reported mail or email being read by others without permission
Can Use Phone and Internet Without Restrictions
The percentage of people who report that they can use phone/internet whenever they want
Can Be Alone at Home With Visitors
The percentage of people who reported they could be alone at home with friends or visitors
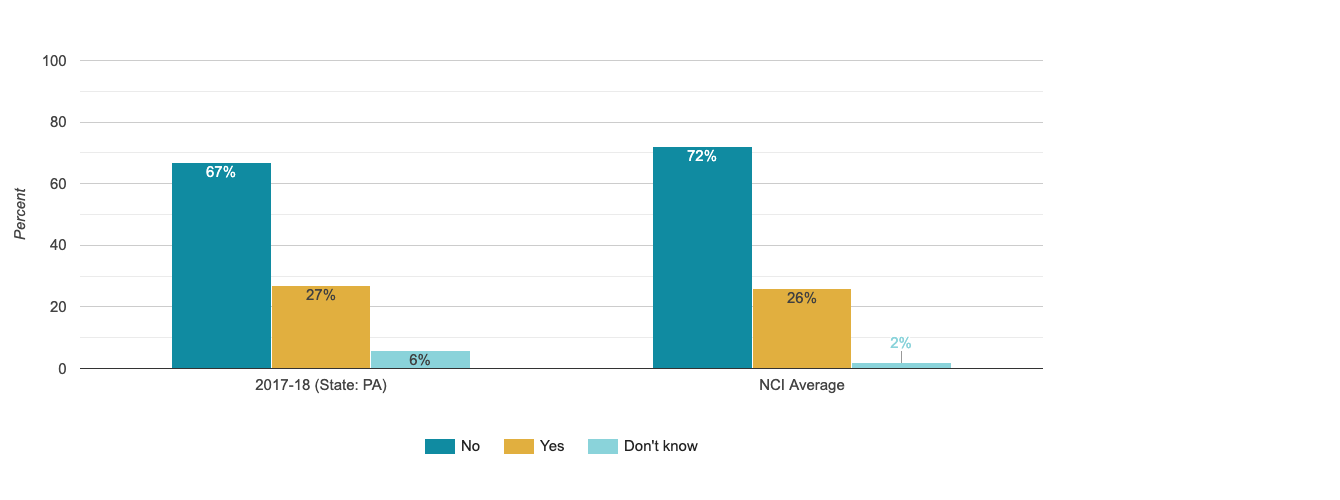
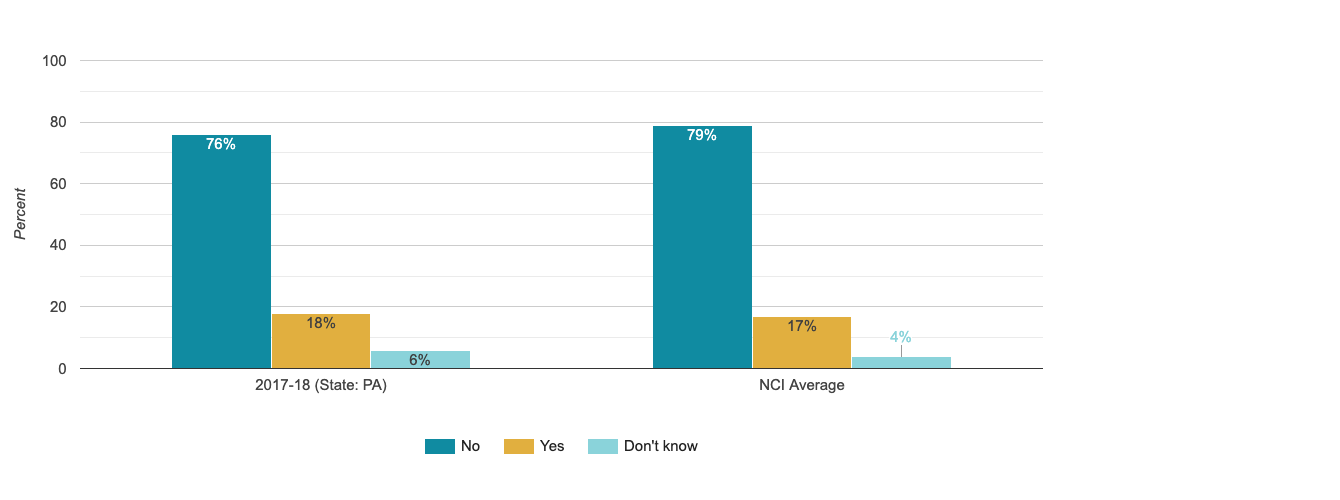
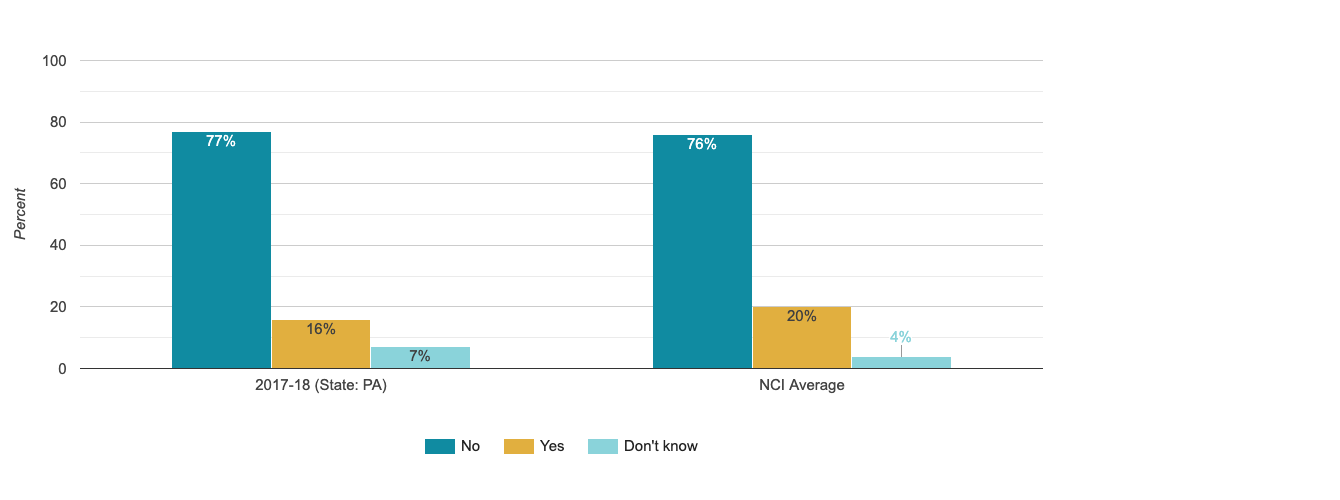
There Are Rules About Having Friends or Visitors in the Home
The percentage of people who report that there are rules about having friends or visitors at home
Has a Place to Be Alone at Home
Percentage of people who reported having a place to be alone at home
Staff Are Respectful
Percentage of people who reported their staff treat them with respect
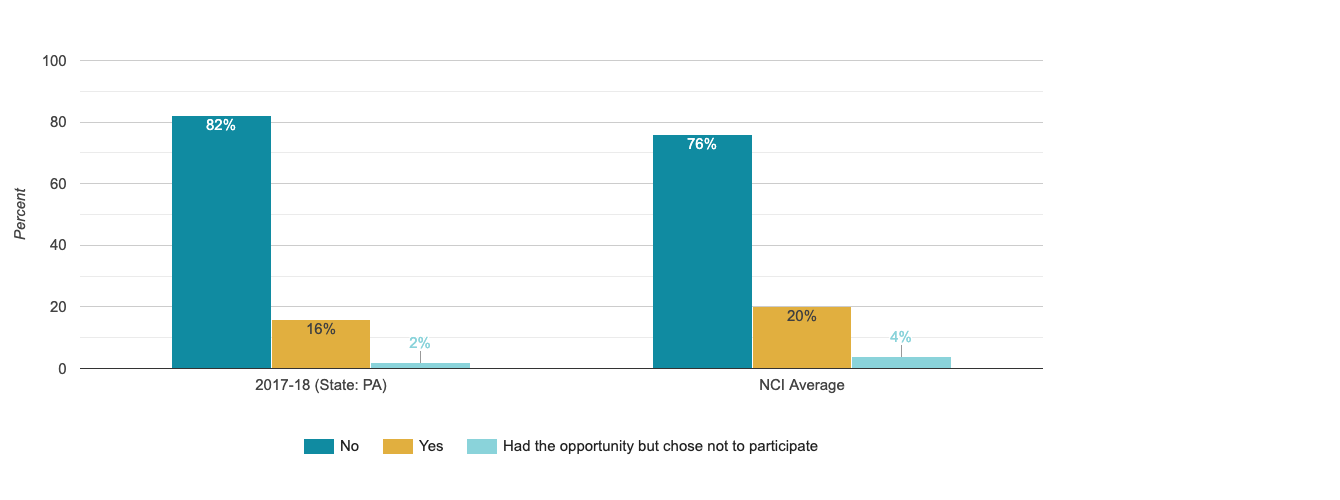
Participated in a Self-Advocacy Meeting, Conference, or Event
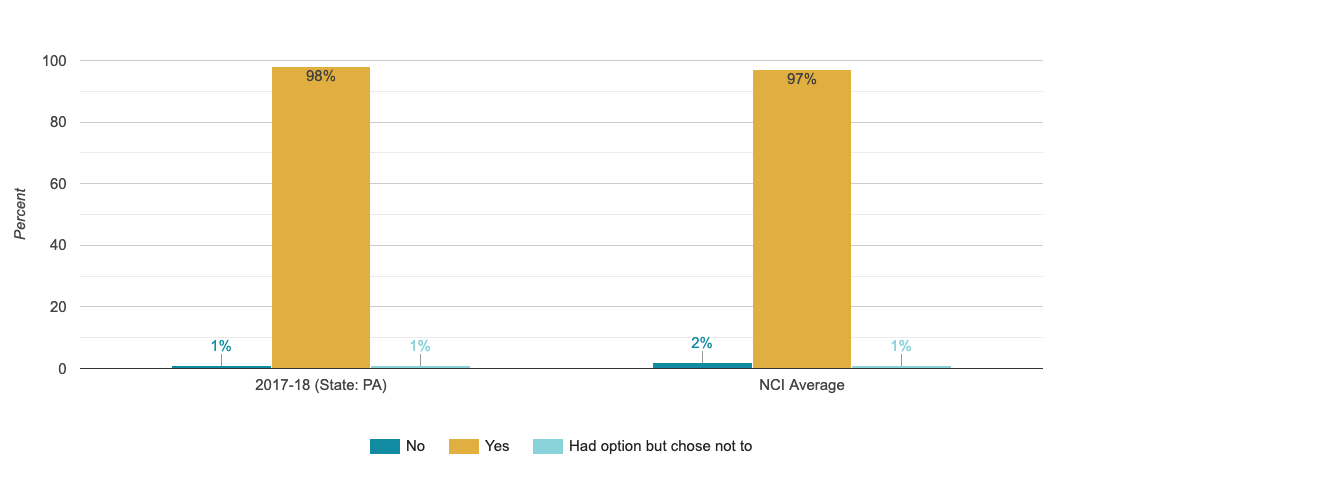
The percentage of people who report having participated in a self-advocacy group meeting, conference, or event, or were given the opportunity to participate but chose not to
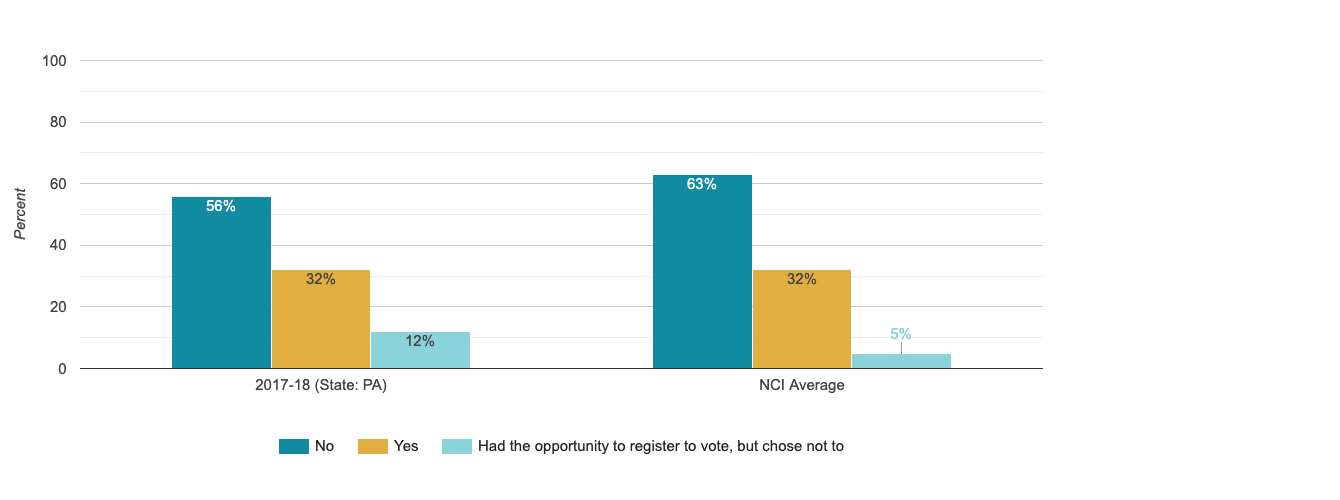
Has Voted
The percentage of people who report having voted in a local, federal or state election or were given opportunity to vote or register to vote and chose not to
Safety
People are safe from abuse, neglect, and injury.
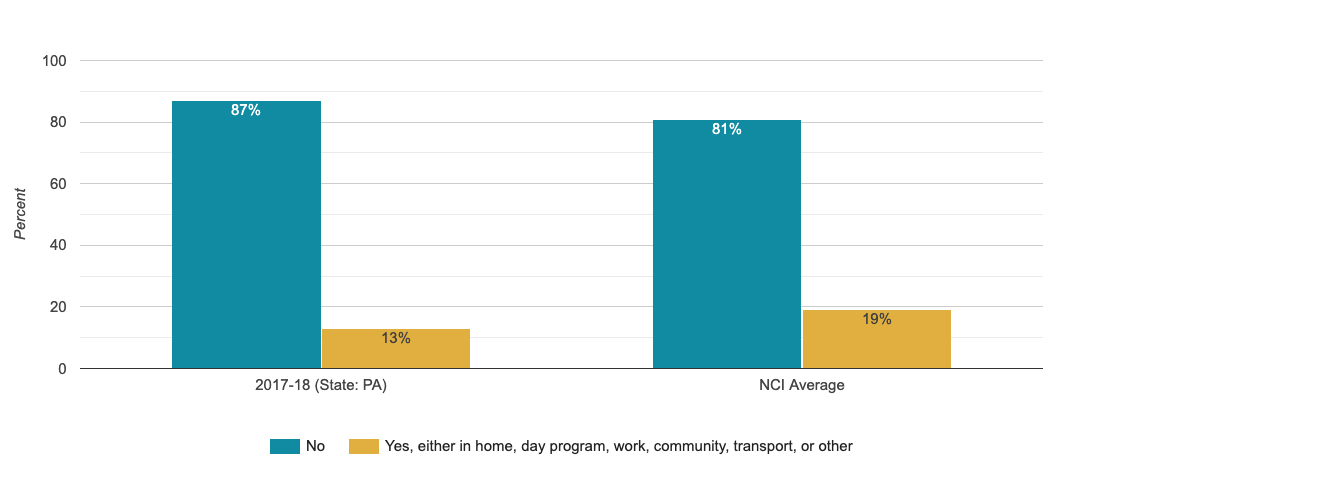
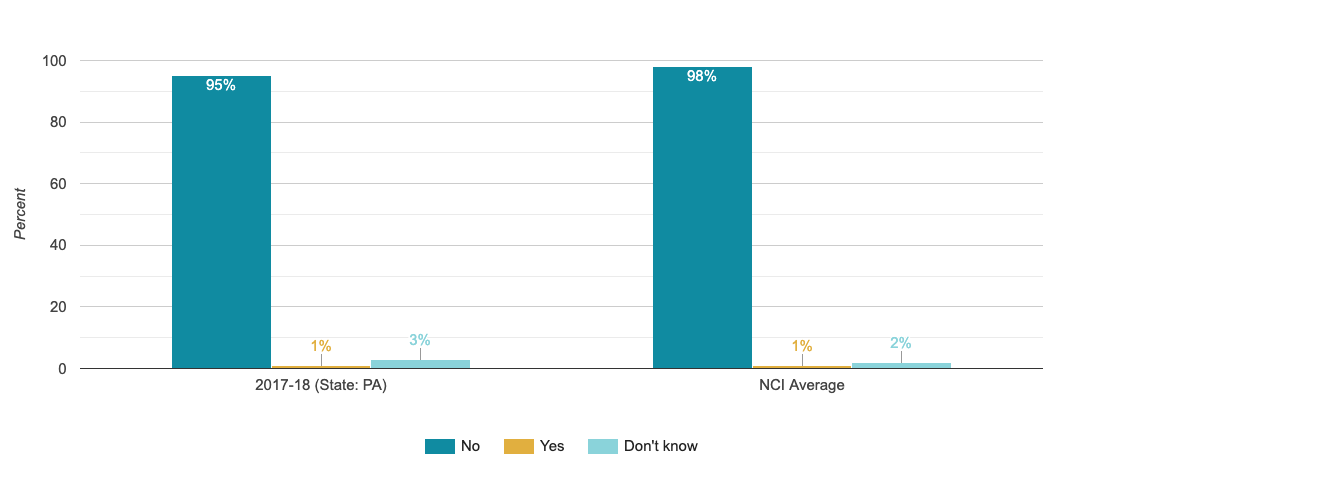
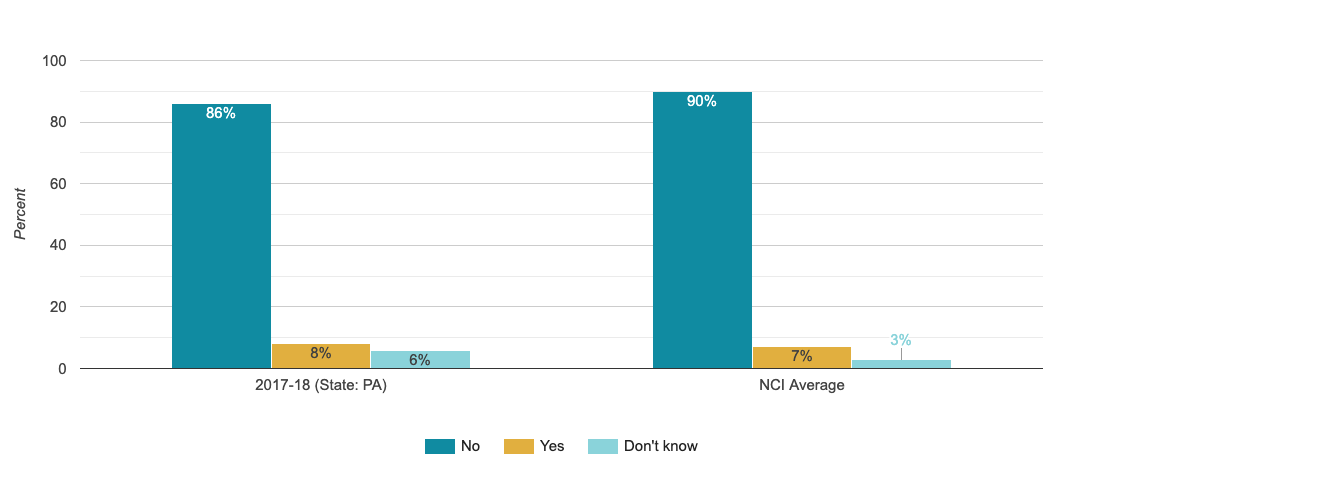
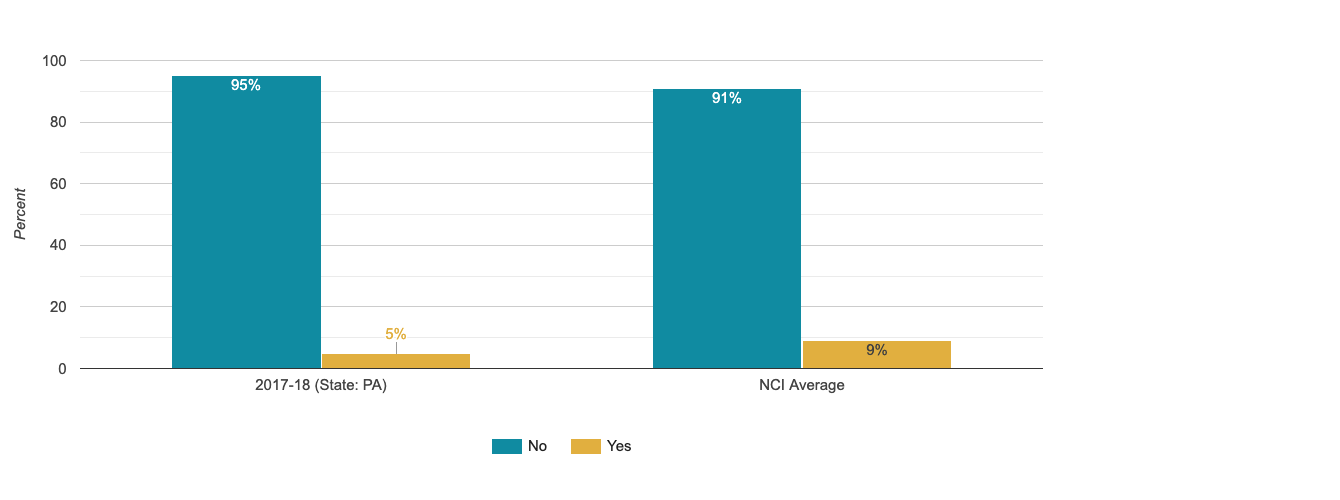
There Are Places Where the Person Feels Afraid
The percentage of people who report that they feel afraid in their home, neighborhood, transport, workplace, day program/ at other daily activity and/or other places